TL;DR: The US 10-year Treasury yield has climbed above 4.75% for two genuinely different reasons — Warsh’s Jackson Hole speech repriced near-term Fed timing at the front end, while renewed US-Iran escalation is now pushing on the long end through inflation persistence — and 4.81% is the level that decides whether 5% becomes a real question.
The 10-Year Yield Is Rising for Two Different Reasons
The US 10-year Treasury yield has climbed through 4.75% to its highest level since January 2025, hovering around 4.76–4.78% Tuesday morning. From the headline alone, it looks like one continuous bond selloff stretching from Fed Chair Warsh’s Jackson Hole speech into renewed US-Iran escalation.
The curve says otherwise. Friday and this week produced almost mirror-image moves across maturities. Warsh hit the front end hardest because investors repriced the timing of another Fed hike. Oil is now pushing more heavily on the long end because renewed Middle East conflict raises a different question — not whether the Fed hikes in September, but whether inflation pressure lasts longer than markets previously assumed. Same 10-year yield, different reason for getting there.
Friday Was About September
Warsh’s speech produced one of the clearest front-end repricings of recent months. The US 2-year yield jumped around 13bp, while the 10-year rose roughly 5bp and the 30-year only 1–2bp:
- 2-year: +13bp.
- 10-year: +5bp.
- 30-year: +1–2bp.
That shape matters. September hike odds moved from below 40% before the speech to above 60% now, and the 2-year yield is where that type of near-term policy adjustment shows up most directly.
Friday therefore looked much more like Fed timing than an inflation regime change. Investors moved another hike closer. They didn’t suddenly conclude long-run inflation was becoming unanchored or that the Fed would have to run a dramatically longer tightening campaign. Put differently, Warsh delivered reversion, not regime change — markets restored a hawkish path that had lost conviction rather than discovering an entirely new one.
Then Oil Changed Which End of the Curve Was Moving
This week has looked different. From Monday through early Tuesday, the 30-year yield rose around 2.6bp, the 10-year about 2.4bp, but the 2-year only around 1bp:
- 2-year: +1.0bp.
- 10-year: +2.4bp.
- 30-year: +2.6bp.
Instead of the front end doing most of the work, the long end is now leading. Fresh US-Iran military escalation is the key difference — Brent has climbed above $91 as direct strikes and counter-strikes returned after several quieter weeks, reopening the risk that higher energy costs persist rather than quickly fade.
That matters differently from Warsh. Oil doesn’t simply change the odds of the September Fed meeting. Sustained energy disruption can affect inflation over several quarters, pushing investors to demand more compensation for holding longer-dated bonds. That makes the 10-year and 30-year yields natural places for inflation-persistence and term-premium concerns to show up.
The move is still too small to call a full credibility shock. But the curve has changed character, and that’s useful information in itself.
The Curve Is Telling Us Which Story Matters
Comparing the two episodes directly: this isn’t one story slowly travelling outward from the 2-year to the 30-year. It’s two catalysts landing on different parts of the same market. Warsh moved maturities where Fed timing dominates. Oil is now moving maturities where inflation persistence and term premium matter more.
That framework also tells us what to watch next. Front-end leadership would point back toward Fed repricing. Continued long-end leadership alongside rising oil would strengthen the inflation-persistence story. If everything starts moving higher together, however, markets will have moved into a more dangerous phase.
Payrolls Will Decide Whether the Warsh Move Sticks
The first test comes from US data. JOLTS and ISM Manufacturing are due Tuesday, ADP follows Wednesday, ISM Services Thursday, and the August jobs report arrives Friday, Sept. 4.
Those releases now matter more because September hike pricing has already moved sharply. A weak run of data would give investors reason to unwind part of Friday’s front-end selloff. Strong readings would keep pressure on the 2-year yield and could push hike expectations further. Even an uneventful employment report could be enough to preserve hawkish pricing if it shows the labor market is holding up and gives the Fed little reason to worry that renewed tightening would damage growth.
Friday’s NFP is therefore the direct falsification test for the Warsh channel.
Oil Decides Whether the Long-End Move Has Legs
The long-end story has a different test: does oil stay high? Brent above $91 has revived inflation risk, but $91 itself doesn’t represent a regime change. The more important question is whether renewed US-Iran conflict keeps pushing crude toward $100.
A sustained move through that area would make higher energy and transportation costs more difficult to dismiss as temporary. That could feed inflation expectations, keep long yields under pressure, and reinforce the case that the Fed may need to stay restrictive even after the next hike. If Brent instead falls back into the high-$80s as the immediate geopolitical shock fades, the long-end Treasury move may fade with it. Oil therefore provides a relatively clean confirmation mechanism: persistent oil, persistent long-end pressure.
What Happens If Both Stories Stay Alive?
This is where the current setup could become much more important. Strong US data would keep Fed-timing pressure on the front end. A persistent oil shock would keep inflation and term-premium pressure on the long end. If both remain active, the entire Treasury curve could begin moving higher together.
At that point, the “Warsh versus oil” distinction would matter less. Markets would be pricing a broader combination of resilient demand, sticky inflation, and higher-for-longer policy risk. That’s a scenario where the current two-mechanism framework effectively breaks — not because it was wrong, but because both mechanisms would have merged into the same larger repricing. And that’s also the scenario where a 10-year yield near 5% becomes much easier to imagine.
ActionForex’s Technical View on the 10-Year Yield: 4.81 Is Where the Chart Gets Serious
Before 5%, however, the Treasury market has to get through 4.81.
The 10-year yield has resumed its rise from 3.96, and 4.81 brings together two major technical references: the 61.8% projection of 3.96–4.69 from 4.36, and the 2025 high.
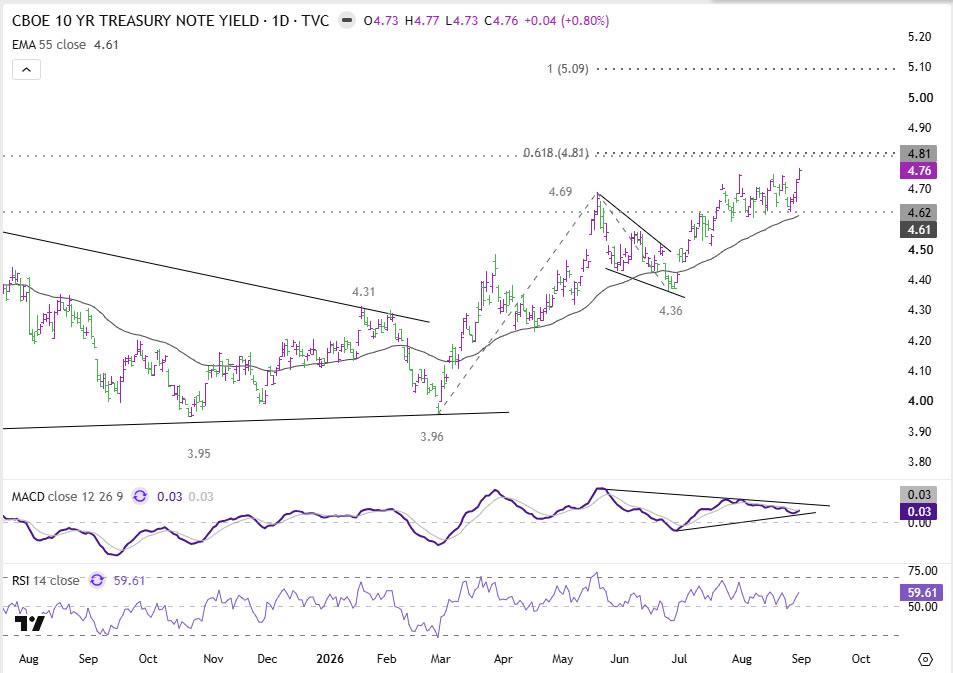
A decisive break of 4.81 would do more than set another marginal high — it would resume the larger rise from 3.60, the 2024 low, and turn attention toward 5.09, the 100% projection near term target. That puts the psychological 5.00 level and the 2023 peak back into immediate discussion while increasing the chance the long-term uptrend is reasserting itself.
Failure at 4.81 would send a very different message. If rejection is followed by a break below 4.62, a short-term top would likely be in place and the broader multi-year range would remain intact. This week’s long-end selloff could then be treated as a geopolitical inflation shock that failed to develop into a lasting trend change.
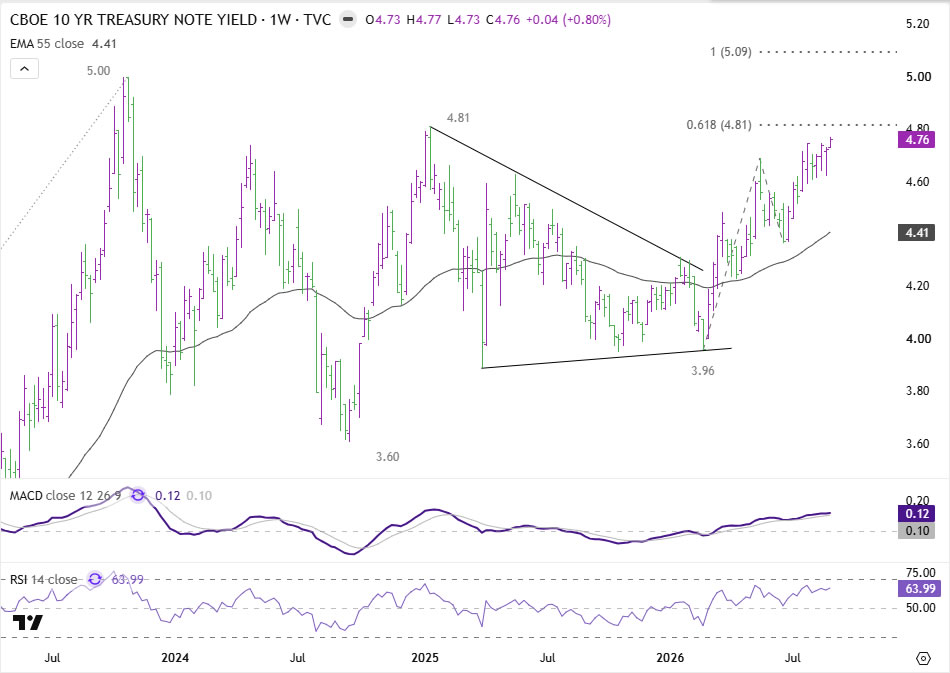
So the 10-year yield has already delivered an eye-catching headline by breaking 4.75%. But 4.81 is where the market has to prove this is more than another move inside the range. If it does, 5% becomes the next question.
Key Takeaways
- The 10-year yield’s climb above 4.75% reflects two distinct forces: Warsh’s Jackson Hole speech repricing Fed timing at the front end, and oil-driven inflation-persistence concerns now pushing on the long end.
- Friday’s move was concentrated in the 2-year (+13bp) with the 30-year barely moving (+1-2bp), confirming a Fed-timing repricing rather than a long-run inflation regime shift.
- This week’s move reversed that pattern, with the 30-year leading (+2.6bp) over the 2-year (+1.0bp), signaling oil and term-premium concerns are now the dominant driver.
- Friday’s August NFP is the key test for the Warsh channel, while sustained Brent strength toward $100 is the key test for the long-end oil story.
- 4.81% is the critical resistance level; a break opens a path toward 5.09% and the psychological 5.00% level, while failure and a drop below 4.62% would suggest this was a temporary geopolitical shock.