Bearish view
- Sell the GBP/USD pair and set a take-profit at 1.3300.
- Add a stop-loss at 1.3500.
- Timeline: 1-2 days.
Bullish view
- Buy the GBP/USD pair and set a take-profit at 1.3500.
- Add a stop-loss at 1.3300.

The GBP/USD pair pulled back today, June 13, as traders refocused on the upcoming US consumer inflation and retail sales report. It also wavered ahead of crucial UK macro data and as tensions between the US and Iran escalated. It was trading at 1.3400, down from last week’s high of 1.13450.
UK GDP and US Macro Data Ahead
The GBP/USD pair pulled back slightly on Monday as geopolitical tensions between the US and Iran continued. The two sides launched strikes during the weekend, pushing crude oil prices higher, with Brent and the West Texas Intermediate (WTI) bouncing back.
Rising energy prices may boost inflation, as evidenced by the rising gasoline prices in the US. Data by AAA shows that the average gasoline price jumped to $3.8760 from $3.800 a week earlier.
The next key catalyst for the pair will be the upcoming US inflation report on Tuesday. Economists expect the data to show that the headline Consumer Price Index (CPI) eased slightly from 4.2% to 4.0%, while the core CPI remained unchanged at 2.9%.
The pair will next react to some notable statements from Fed officials like Austan Goolsbee, Lisa Cook, and John Williams. These officials will provide more information on what to expect in the next meetings. The GBP/USD pair will next react to the upcoming US retail sales on Thursday.
Meanwhile, the UK will publish some important macro numbers that will provide more information about the state of the economy. Economists expect this report to show that the economy grew by 0.1% in May MoM and by 1.2% on a YoY basis. Andrew Bailey, the BoE governor, will deliver statements hinting at what the bank will do later this year.
GBP/USD Technical Analysis
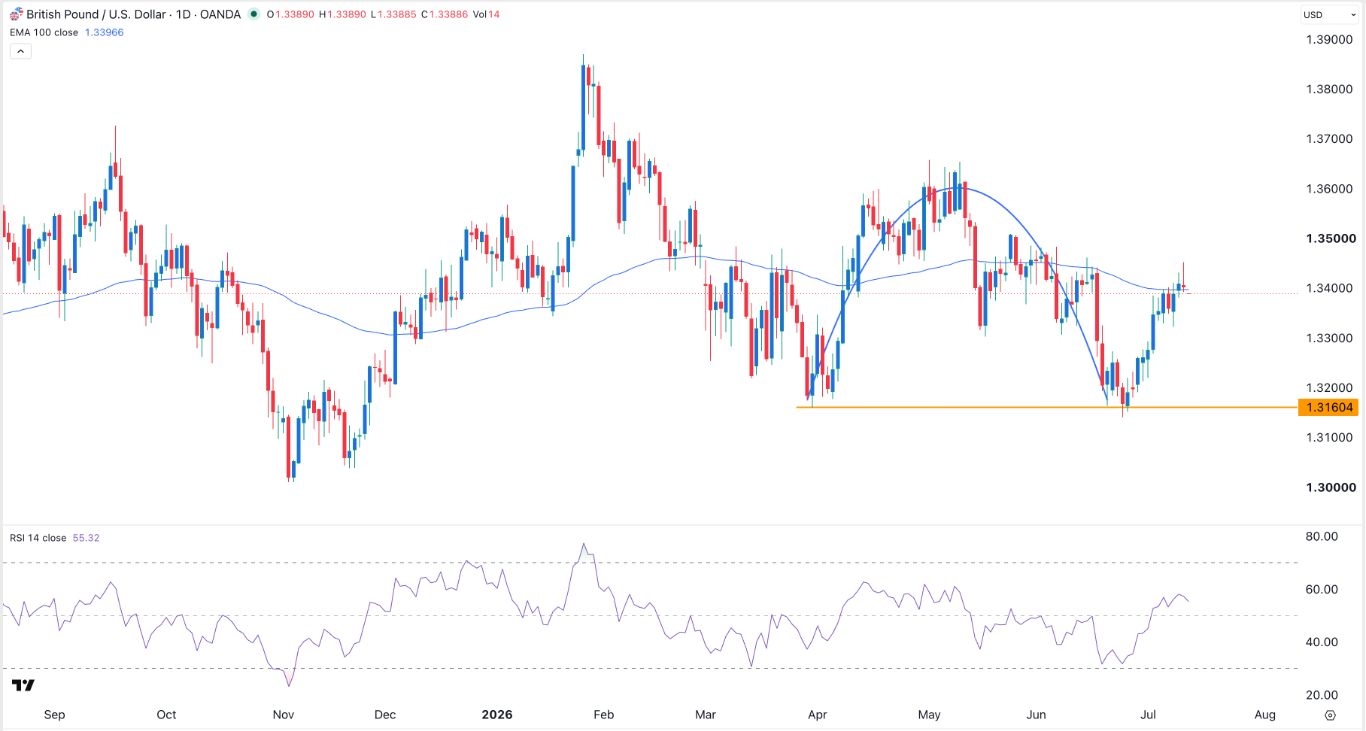
The daily chart shows that the GBP/USD pair has been in an uptrend from a low of 1.3140 in June to a high of 1.3450 last week. It has formed a dragonfly doji candlestick pattern, which is made up of a small body and a long upper shadow. This pattern normally leads to a bearish reversal over time.
There are signs that the recent rally is losing momentum, with the Average Directional Index (ADX) falling to 19 from last week’s high of 29.30. Therefore, the pair will likely continue falling as traders book profits. If this happens, it will drop to the key support level of 1.3300.
Ready to trade our free trading signals? We’ve made a list of the best UK forex brokers worth using.
Crispus Nyaga is a Technical Analyst at DailyForex with more than eight years of experience as a financial analyst, coach, and trader. He specializes in technical analysis of major currency pairs and cryptocurrencies, using chart patterns, trend structure, and key indicators to frame trading scenarios for Forex and digital asset markets. Crispus has worked with well-known brokers including ATFX, easyMarkets, and OctaFX, and his market commentary has been published widely on platforms such as Seeking Alpha, InvestingCube, Capital.com, and Invezz.
As seen on: SeekingAlpha, Macrostreet.com, Invezz.com, Forbes, Investing.com, Marketwatch, Crypto.news