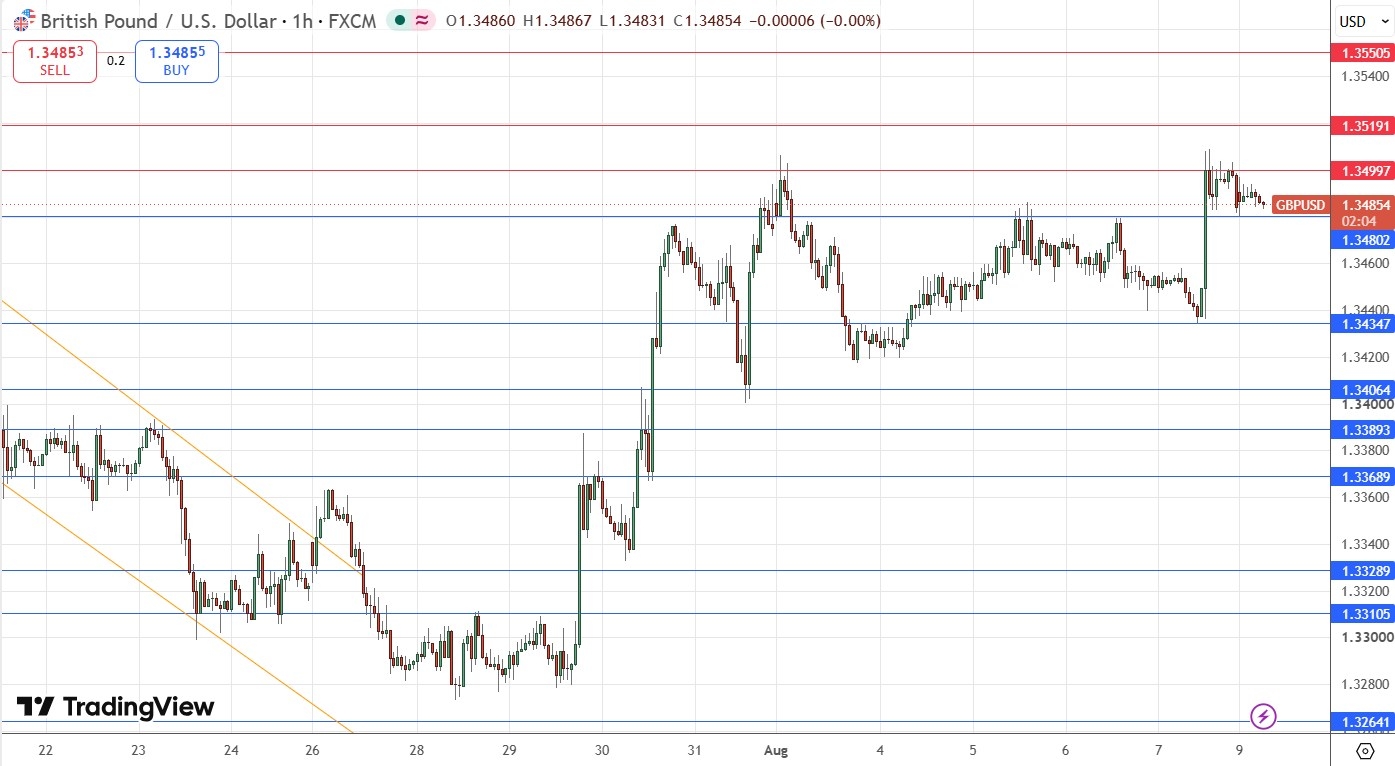
Cable remains within its 15-month range, yet the quietness is becoming more interesting than reassuring. The market has absorbed several attempts to move higher without producing the kind of follow-through that would settle the question of direction.
That leaves traders with a familiar but awkward situation: neither side appears ready to concede, while the balance beneath the surface may be changing. The important issue is not whether the market is moving quickly, but whether the recent pause starting to show whether bulls or bears are more likely to prevail over the medium term.
GBP/USD Shows a Subtle Shift Beneath the Surface
The recent change is not a dramatic break in the wider picture, but a subtle improvement in the way GBP/USD has behaved on pullbacks. Sellers have had opportunities to press their advantage, yet the market has increasingly found buyers before a deeper decline can develop. That matters because the pair had previously looked vulnerable to simply drifting lower whenever momentum faded.
At the same time, attempts to push higher have met a familiar response. This creates a more balanced setup than the one seen earlier in the week: buyers appear more willing to defend weakness, but they have not yet shown that they can maintain control when the market tests the upper edge of its recent range. The next phase may therefore depend less on headlines than on whether either side can turn this patience into conviction.
$1.3500 Remains the Key Resistance as Support Quietly Builds
The technical structure now has three levels worth looking at closely. The large round number at $1.3500 remains the key resistance. It has continued to hold despite repeated approaches, which suggests that there is still sufficient selling interest or profit-taking near that area to prevent a sustained advance. A brief move above it would not, by itself, change much; the more meaningful evidence would be a daily close above it followed by an ability to remain established above it.
Below, $1.3435 has become the standout strong support level over the past few days. Its importance comes from the way the price has responded there, not merely from its position on the chart. This level now looks like a very pivotal support levels for buyers.
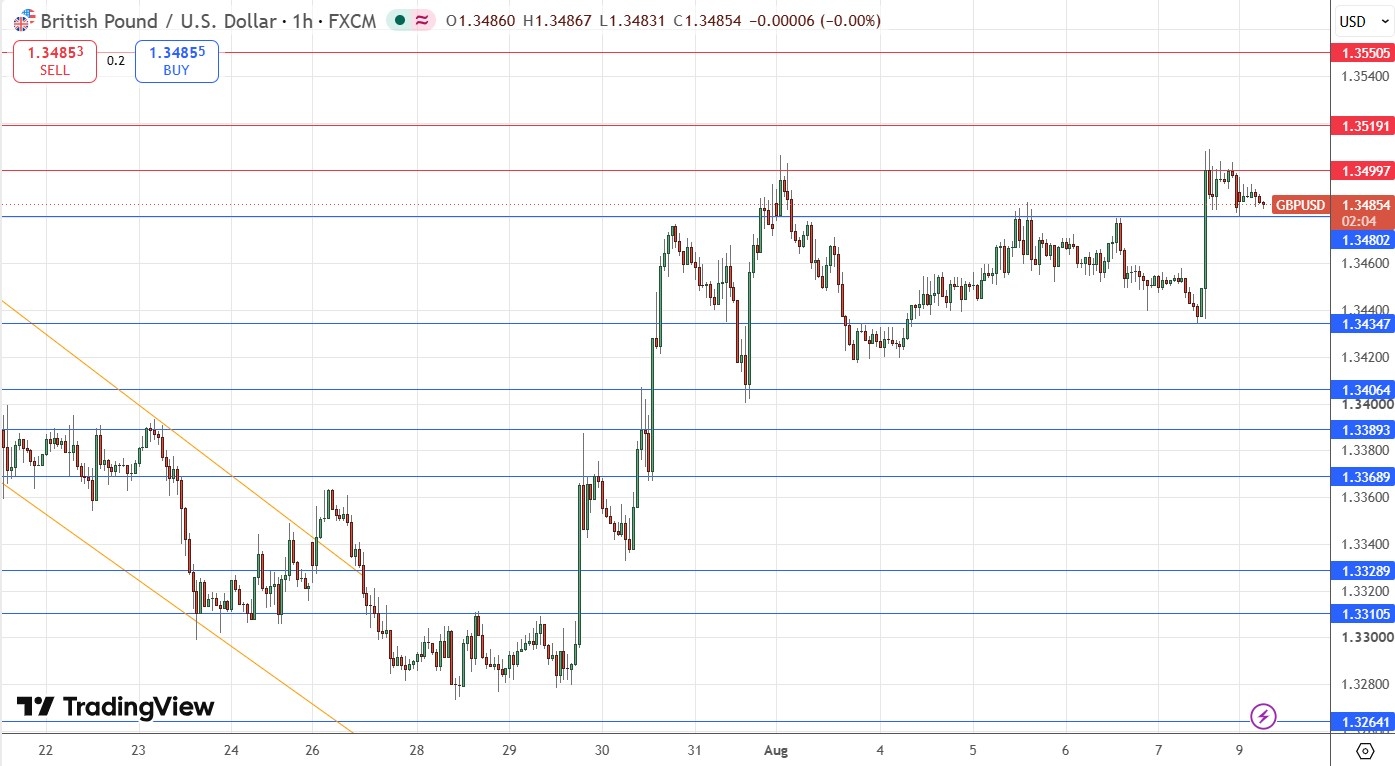
GBP/USD Hourly Price Chart July/August 2026
The newer $1.3480 support has also held through most of today’s Asian session. This makes it a useful intraday pivot, although it does not look likely to be as strong as $1.3435. Holding above it keeps the market near the upper part of its range; it it breaks down, a trip to $1.3435 or nearby would look likely to happen over the remainder of Monday and possibly into Tuesday or even Wednesday, when highly important US CPI (inflation) data will be released.
Why the Range May Be Easy to Misread
The risk is that traders read the growing support too simply and assume it automatically points to a breakout. Support can reflect genuine demand, but it can also reflect a market that is temporarily unwilling to commit in either direction. Repeated failures at a conspicuous resistance level can gradually erode bullish enthusiasm, even while the downside remains protected.
There is also a psychological trap in treating a tight range as a signal that a large move is imminent. Sometimes the market is gathering energy; sometimes it is merely waiting for a reason to reprice. The distinction is usually visible only after the fact. For now, the most useful observation is that buyers are defending weakness more effectively, while sellers are still defending strength. That is a standoff, not yet a resolution.
What Would Change the Current Reading
The constructive interpretation is that the improved support structure is the early sign of a market becoming more comfortable at higher levels. If GBP/USD can hold above $1.3480 and eventually establish itself beyond $1.3500, the current hesitation would look more like consolidation than rejection.
The opposing view remains plausible. Another firm rejection from $1.3500, followed by a sustained move below $1.3480, would weaken that interpretation and place $1.3435 under closer scrutiny. A loss of the stronger support would indicate that the recent resilience was less durable than it first appeared.
The Next Test Reflects Market Conviction
For the moment, the market is offering information through its reactions rather than through a clear directional move. Whether $1.3480 continues to act as an intraday floor, and whether $1.3500 again limits progress, should reveal more about the quality of demand and supply than a single isolated candle.
The coming sessions may show whether the new support is becoming part of a broader shift in behaviour, or whether the familiar resistance still defines the limits of the range.
Ready to trade our GBP/USD analysis? Here is our list of the best Forex brokers worth checking out.