From stubborn inflation, disagreements on Capitol Hill over the Federal Reserve’s monetary policies, geopolitical tensions in the Middle East, energy-driven inflation, and the upcoming midterm elections, there is no shortage of uncertainties rattling the stock market this year.
When you look at any one of these issues in isolation, you might think the stock market is headed toward freefall. But even with all of the drama, the S&P 500 (^GSPC +1.20%) is up nearly 3% in 2026. That’s important to call out, as most investors shortchange the index’s resilience.
With that said, a little-known market indicator could be sending an ominous warning that investors are largely overlooking right now. Let’s unpack what investors should expect for the remainder of this year, as volatility seemingly isn’t going away anytime soon.
Image source: Getty Images.
The S&P 500 CAPE ratio reached its second-highest level in history
When listening to financial news programs, it’s not unusual to hear commentators assess valuation in the overall market rather than a specific stock. Generally, when an analyst is discussing whether the market is over- or undervalued, they are referring to earnings. In other words, Wall Street benchmarks the average price-to-earnings (P/E) or forward earnings multiples across the index against historical thresholds to determine whether the market is frothy.
Don’t get me wrong: Analyzing these metrics can be quite helpful. But in my eyes, traditional valuation multiples fall short at capturing more nuanced valuation dynamics. Instead, I choose to look at the cyclically adjusted price-to-earnings (CAPE) ratio.
The CAPE ratio is pretty nifty because it accounts for earnings over the past 10 years. By casting its net this wide, the CAPE ratio inherently captures and smooths out different economic cycles, inflation levels, and one-time events that influence earnings quality in the market.
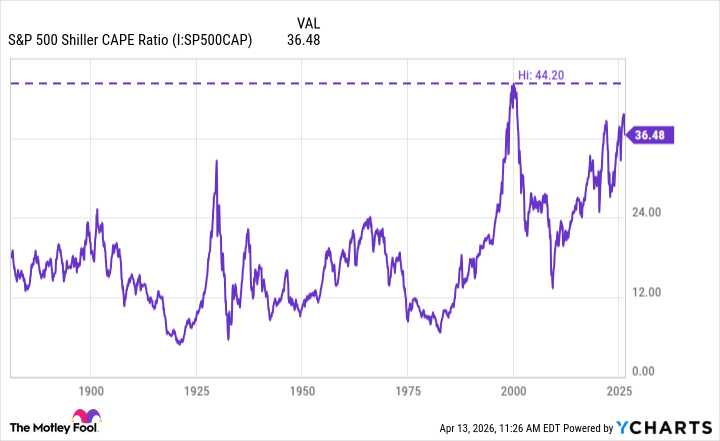
S&P 500 Shiller CAPE Ratio data by YCharts
As the graphic illustrates, the CAPE ratio currently sits at 36. This is the second-highest reading in history and about 18% below its record level of 44.
Why is a rising CAPE ratio important, and what does it signal about the direction of the stock market?
There are two notable peaks in the CAPE historical chart. The first occurred during the late 1920s, when the CAPE ratio reached a then-record level in the mid-30s. The second peak — which is the all-time high — happened nearly 25 years ago.
In both cases, the stock marketed cratered following a pronounced surge in the CAPE ratio. Back in the 1920s, the market crashed, and the economy entered the Great Depression. In more recent history, the dot-com bubble burst in the year 2000.
For the last few years, the S&P 500 has been in a bull market, driven by the artificial intelligence (AI) revolution. Besides technology stocks, peripheral industries that touch AI — such as energy and industrials — have helped drive the stock market to record highs. While the generational bull run has taken a breather in 2026, the CAPE ratio suggests the S&P 500 may still be overvalued relative to historical norms.
Given these dynamics, history suggests that the stock market could be headed for a harsh, long-lasting crash just as it did after the CAPE peaked back in the 1920s and 2000.
Will the stock market actually crash in 2026?
In addition to these historical patterns, the Nasdaq Composite technically entered correction territory in late March. In some ways, this weakness supports the theory that the stock market is fragile and is destined to plummet further.
While it’s easy to follow this logic, I see things a bit differently. During the late 1990s, many of the casualties of the dot-com era had no business fetching premium valuations in the first place. In other words, many companies that went bankrupt by 2000 never had a concrete, detailed plan to benefit from the rise of the internet.
Rather, these companies simply relied on the transformative narrative of internet-driven technologies to market how their business would transform. But these pipe dreams seldom came to fruition.
While it’s easy to connect dots between the dot-com boom and the artificial intelligence (AI) supercycle, I ultimately see these revolutions as different opportunities. Many companies, especially in big tech, are already monetizing AI products and services profitably — allowing them to reinvest in the technology and broaden their ecosystems.
Nevertheless, I’ll admit it’s difficult to predict the stock market’s near-term trajectory. As referenced earlier, there is no shortage of variables fueling uncertainty across the stock market this year.
The prudent strategy is to reduce exposure to volatile growth stocks or speculative positions. For now, complementing a healthy cash balance with blue chip stocks that boast diversified revenue streams and durable business models is a great way to insulate your portfolio from outsized volatility. Even if the market does crash, this architecture should limit your losses while also providing you with adequate financial flexibility to buy the dip.