Key Highlights
- Gold started a fresh decline below the $4,550 support.
- A major bearish trend line is forming with resistance at $4,525 on the 4-hour chart.
- WTI Crude Oil extended losses and traded below $95.
- EUR/USD started a minor recovery wave above 1.1620.
Gold Price Technical Analysis
Gold failed to surpass $4,650 and trimmed gains against the US Dollar. The price dipped below $4,600 and $4,550 to enter a bearish zone.
The 4-hour chart of XAU/USD indicates that the price even declined below $4,500, the 100 Simple Moving Average (red, 4 hours), and the 200 Simple Moving Average (green, 4 hours). A low was formed at $4,401, and the price is now consolidating losses.
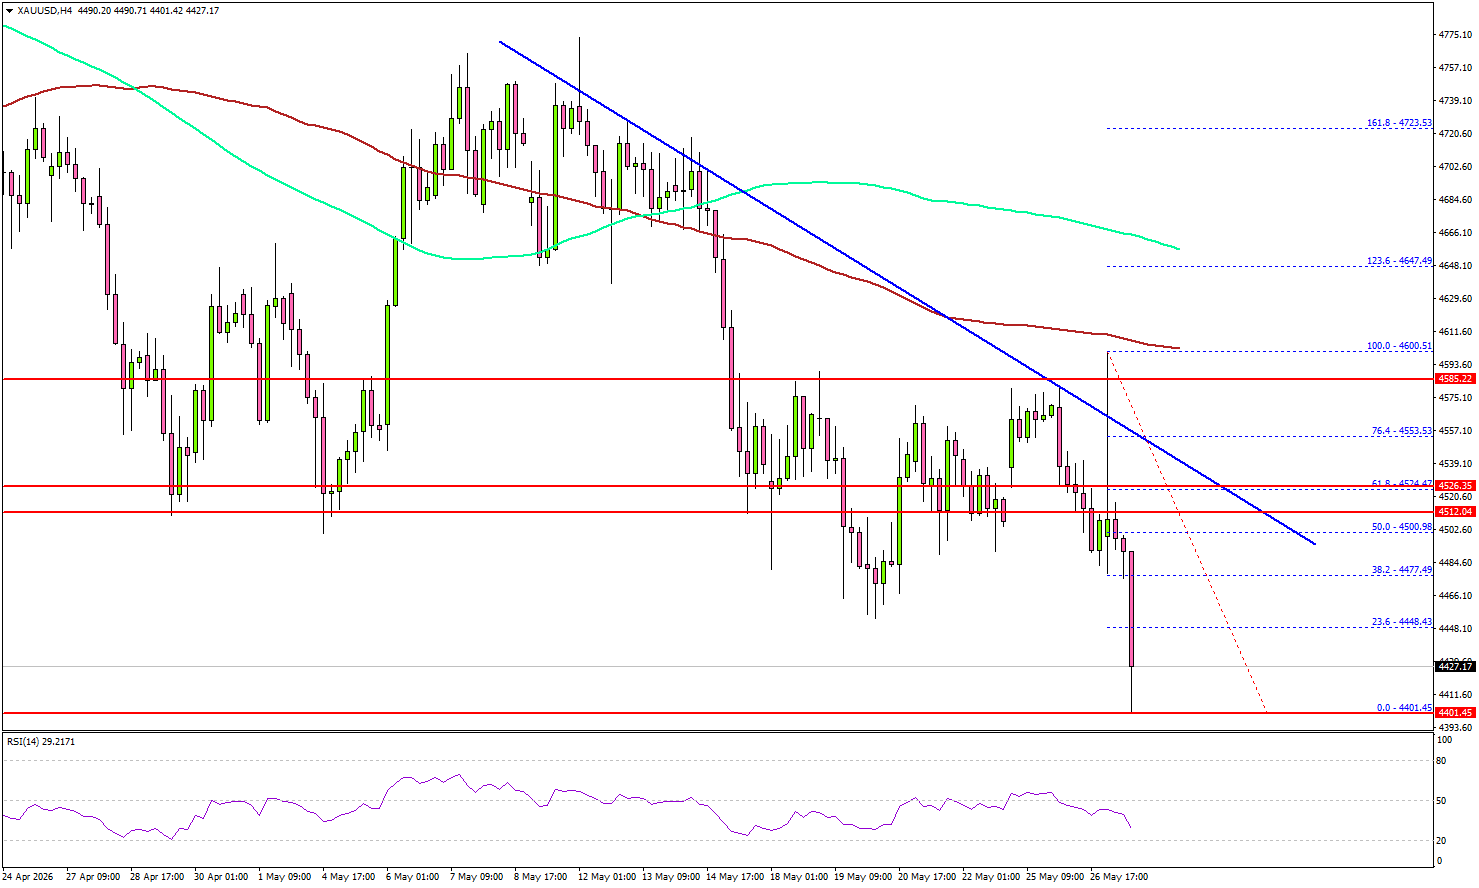
On the upside, immediate resistance is $4,475. The next major resistance sits near $4,500 and the 50% Fib retracement level of the downward move from the $4,600 swing high to the $4,401 low.
The main resistance could be near $4,525 and the 61.8% Fib retracement level. There is also a major bearish trend line forming with resistance at $4,525. A clear move above $4,525 could open the doors for more upside. In the stated case, the bulls could aim for a move toward $4,600 or even $4,620.
If there is another decline, Gold might find bids near the $4,400 level. The first major support sits at $4,365. The next support could be $4,320, below which the price might slide to $4,300. The main support sits at $4,200. Any more losses might call for a test of $4,065 or even $4,000 in the coming days.
Looking at WTI Crude Oil, the price started a fresh decline and there are chances of more losses below the $90 zone.
Economic Releases to Watch Today
- US Initial Jobless Claims – Forecast 243K, versus 244K previous.
- US Gross Domestic Product Q1 2026 (Preliminary) – Forecast 1.3% versus previous 2.1%.