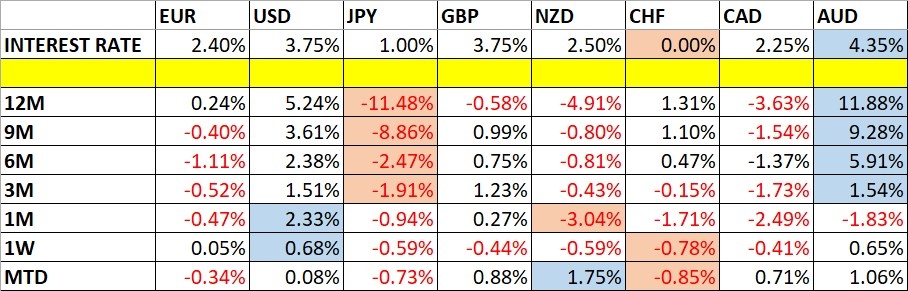
Fundamental Backdrop and Market Sentiment
I wrote on 19th July that the best trades for the week would be:
-
Long of the USD/JPY currency pair. This produced a gain of 0.90% over the week.
-
Short of the EUR/USD currency pair. This produced a loss of 0.60% over the week.
The total gain of 0.30% averages to 0.15% per asset.
A summary of last week’s most important data in the market:
-
European Central Bank Policy Meeting – the ECB left rates unchanged, but markets saw it as a “hawkish hold”, which helped the Euro maintain its relative value last week, unlike most other European currencies.
-
UK CPI data – this fell by a tick more than expected, to 2.6%, which helped weaken the British Pound.
-
Canadian CPI data – notably lower than expected, with a month-on-month deflation of 0.4% compared to the expected 0.2%. This helped the Loonie to weaken.
-
New Zealand CPI data – the quarterly data was just a tick higher than expected at 1.5%.
-
Australian Unemployment Rate – this was surprisingly strong.
-
UK Unemployment Claims – lower than expected.
The big stories last week were the mostly softer inflation-related data, the new government (of the same political party) in the UK, and the further deterioration of relations between the USA and Iran to something approaching imminent multi-front war, with a major US attack seeming called off at the last minute on Friday night.
The unexpectedly soft US CPI and PPI data will relieve the pressure on the Fed to hike rates, although one hike of 0.25% later this year is still seen as probable. However, the broad US stock market lost value and the NASDAQ 100 Index touched a fresh 2-month low, which is likely caused by fundamental factors and the prospect of an escalation in the US/Iran war. Language from the Federal Reserve remains hawkish, which could also be overpowering any relief from this data. We remain in a generally hawkish central bank environment.
The major US strike over the weekend was called off for reasons that are generally understood as either or both of a) Iran finally wants to get serious about talks b) the USA is running low on munitions and has not replenished its stocks sufficiently to have a margin of safety. It is hard to believe anyone in the USA really believes there is any prospect of a “good” deal with Iran, but it seems some do, or at least they are prepared to sit back and hope to deter a nuclear Iran.
With the prospect of an imminent escalation seemingly on hold for a while, we can expect that stock markets will open at least a bit higher, and that the price of Crude Oil and Gasoline will open lower.
The Week Ahead: Key Data and Events to Watch
Next week will be significant, with several highly important data items. The coming week’s most important data points, in order of likely importance, are:
-
US Federal Reserve Policy Meeting
-
US Core PCE Price Index
-
Bank of Japan Policy Meeting
-
Bank of England Policy Meeting
-
Australian CPI (inflation)
-
US Advance GDP
-
Canadian GDP
Monthly Forex Forecast: July 2026 Overview
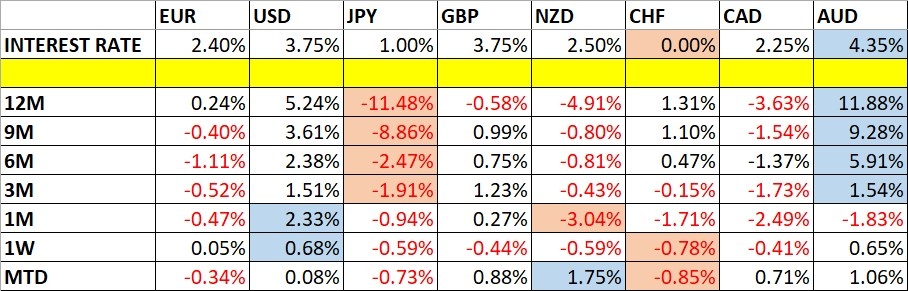
Currency Price Changes and Interest Rates
For the month of July, I forecasted that the EUR/USD currency pair will decline in value, and the USD/JPY currency pair will rise in value. The performance so far is:

Weekly Forecast 26th July 2026
Last week, I made no weekly forecast.
This week, I again make no forecast, as there were no exceptional price movements last week.
Volatility decreased last week, with only 7% of the notable currency pairs and crosses moving by more than 1% in value. Next week’s volatility is likely to be notably higher.
You can trade these forecasts in a real or demo Forex brokerage account.
Technical Overview and Key Levels
Key Support and Resistance on Major FX Pairs
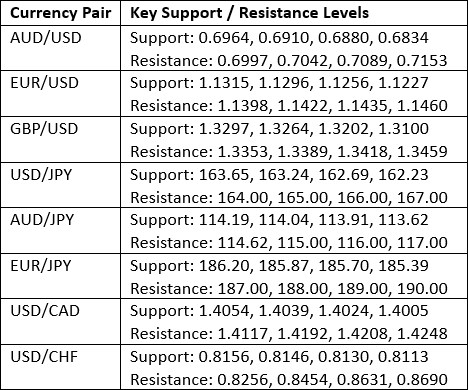
Key Support and Resistance Levels
US Dollar Index
The US Dollar printed a bullish candlestick last week, which made its highest close in 15 months close to the key long-term resistance level at 101.39. The price closed very near the top of its range. These are bullish signs for the US Dollar.
Even as inflation data falls globally, the Fed maintains hawkish rhetoric and is still seen as on a hiking path. This, coupled with the effective closure of the Strait of Hormuz and an increasing expectation that the USA/Iran war with re-erupt with full force at some point over the next few weeks, is putting a big into the greenback.
Technically the major question is whether the price action is strong enough, whether the US Dollar has momentum enough, to make a technical breakout beyond 101.39. If this happens this week and the breakout holds, that will be a very bullish sign.
I am very comfortable being long of the US Dollar right now.
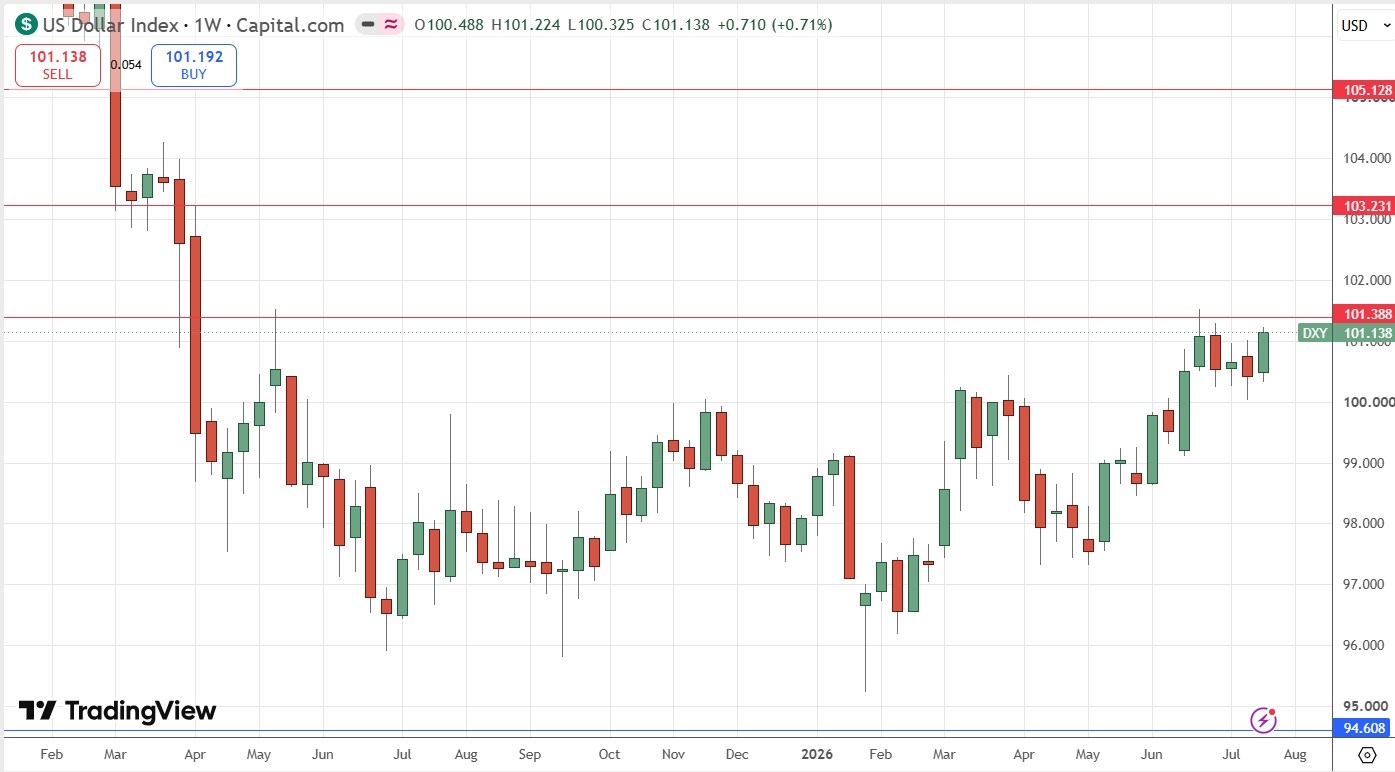
US Dollar Index Weekly Price Chart
USD/JPY
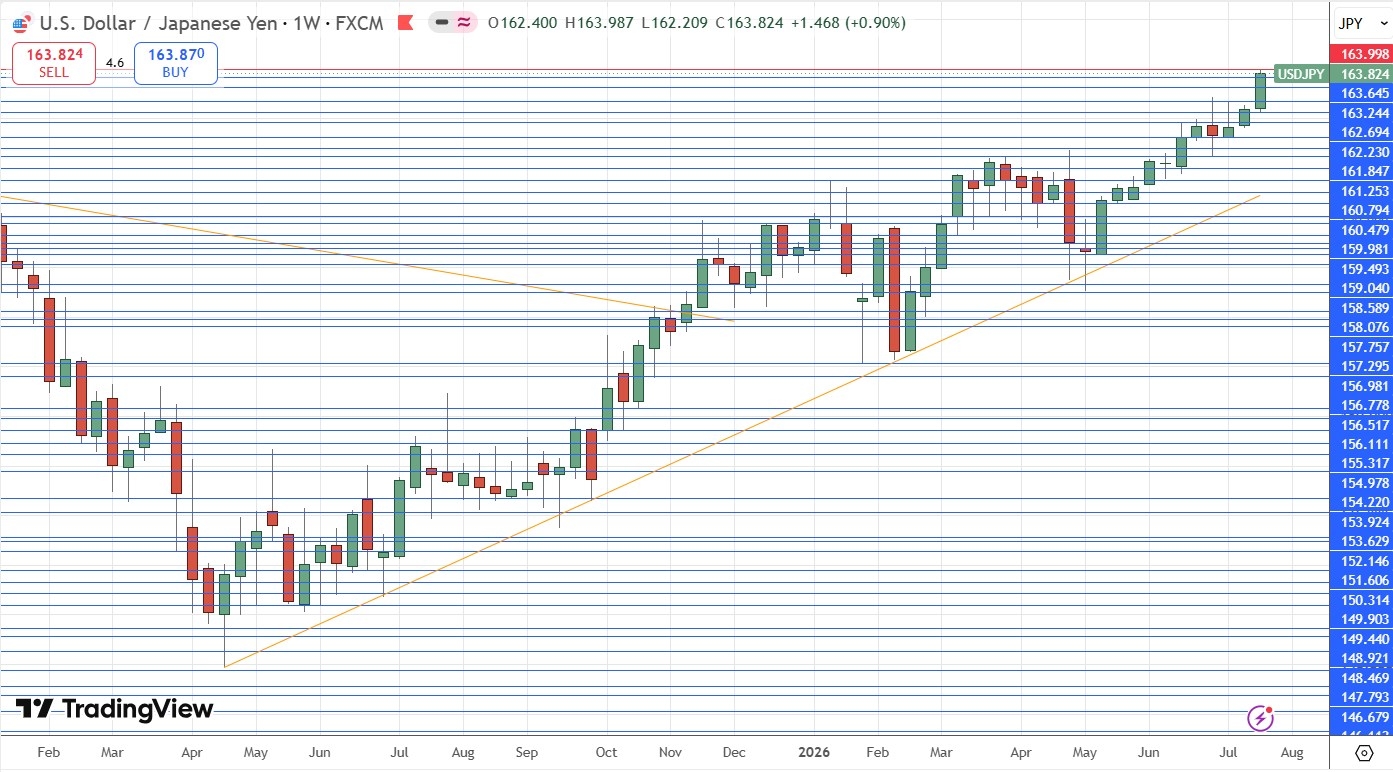
The USD/JPY currency pair made a bullish breakout last week, reaching a fresh 39-year high and touching the round number at ¥164. The bullish candlestick was relatively strong – the strongest since last May and closed near its high although still below the round number.
The US Dollar is the strongest major currency right now due to a hawkish Fed and some demand for it as a safe haven. The Japanese Yen is the major currency showing the most long-term weakness, with the extraordinarily high level of Japanese debt preventing a quicker imposition of a more hawkish monetary policy, although the Bank of Japan is still expected to hike its interest rate over the near term, although this is not expected to happen next week at the Bank of Japan’s policy meeting. The US Federal Reserve will also be meeting next week, so we are bound to see a lot of focus on this currency pair for several reasons over the coming days.
I think this is a great Forex pair to be long of with a wide stop loss, and to sit tight. The price chart below shows a long-term ascending trend line which shows just how well-established and powerful this long-term bullish trend is.
I am very comfortable being long of this currency pair.
USD/JPY Weekly Price Chart
EUR/USD
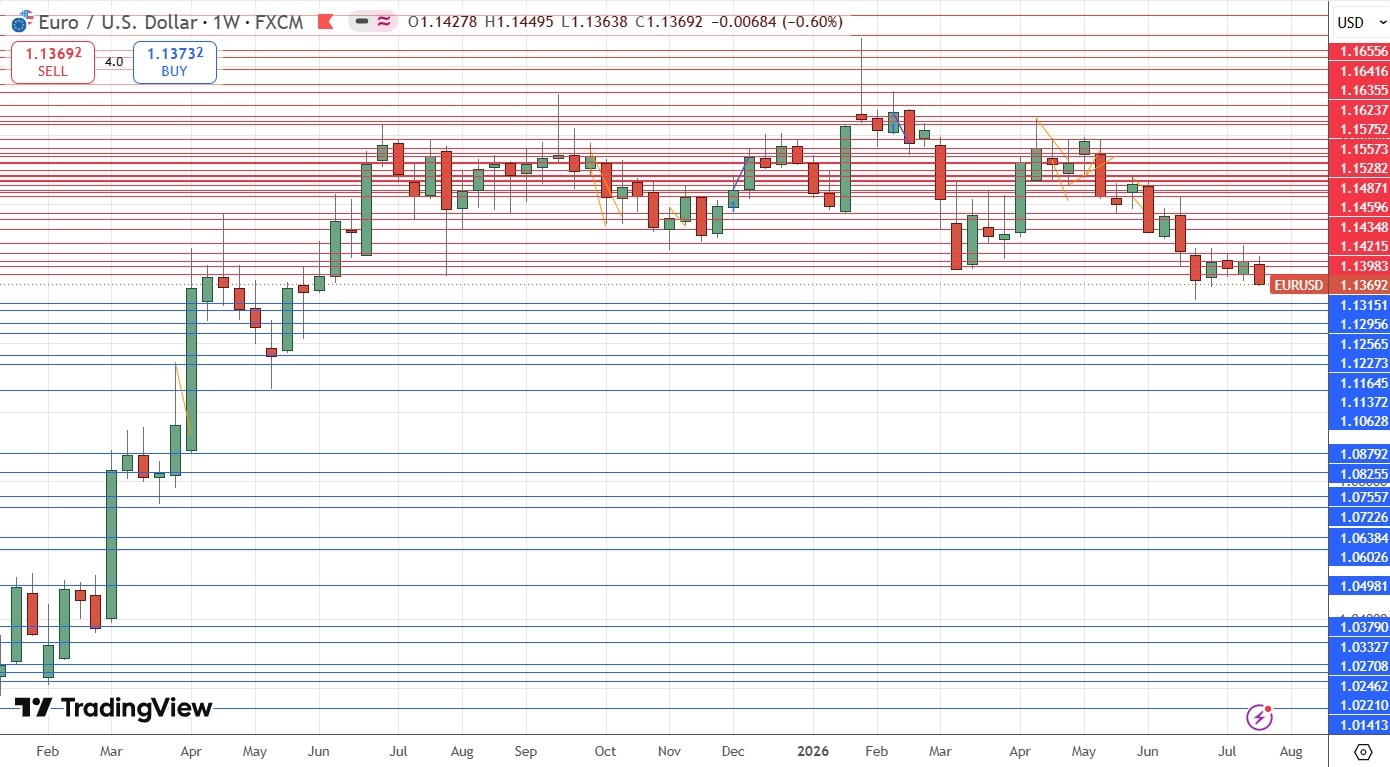
The EUR/USD currency pair was holding its ranging behaviour despite the renewed strength of the US Dollar, but there are now technical signs that the bearish breakdown is getting underway. Last week’s close was the lowest in over a year, and the price closed near the low of the full-bodied weekly candlestick. These are bearish signs. What is also interesting is how the price action over the last few months is looking like a topping pattern, which increases the sense that the price is about to tumble.
It is not possible to see without drilling down to shorter time frames, but new resistance levels have been printed over the past week by bearish price action, which reinforces the bearish case.
I have been short of this currency pair for a while, and I am getting increasingly comfortable with my short trade here, which might run for a while, unless the European Central Bank does something surprisingly hawkish, but there is no meeting there over the coming week.
EUR/USD Weekly Price Chart
NASDAQ 100 Index
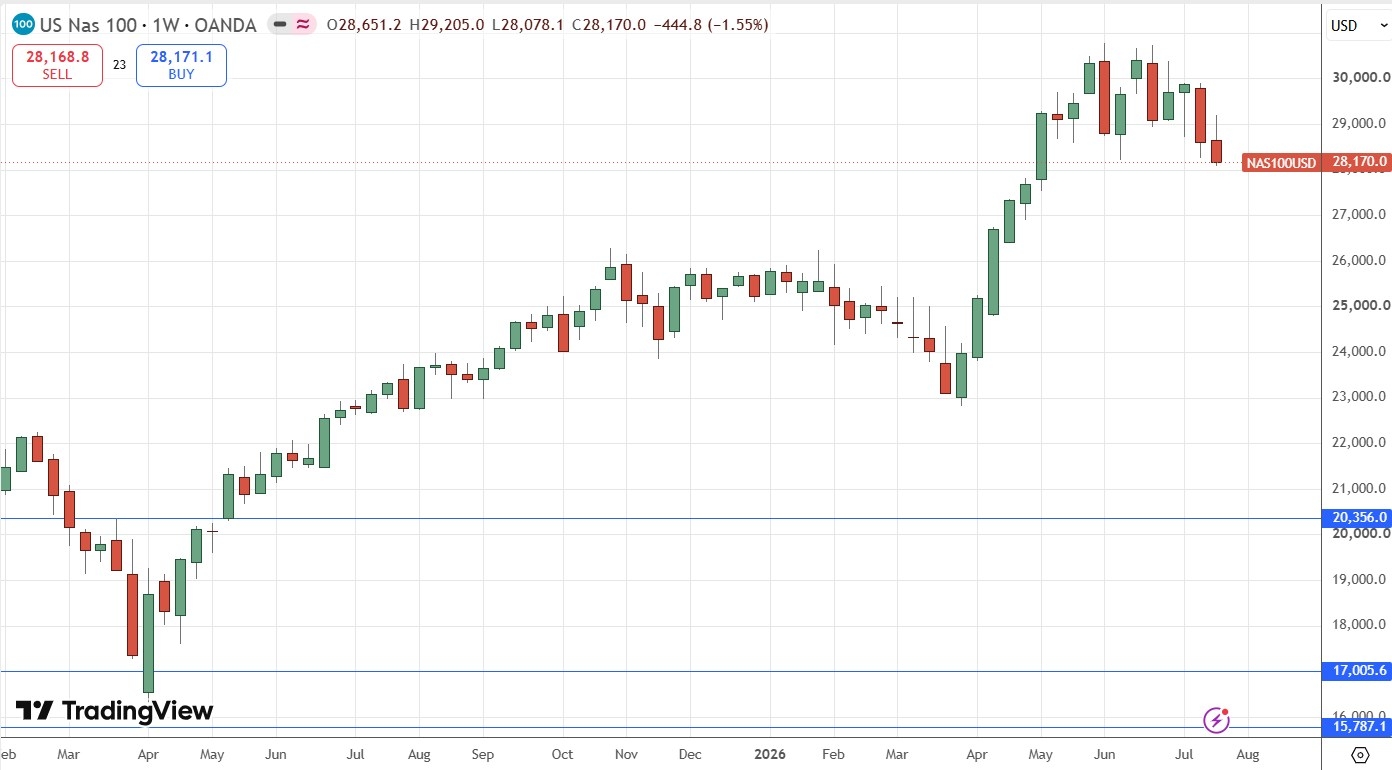
US stock markets have been looking increasingly weak, and there is no index that looks technically weaker than this one. The weekly price chart below of the NASDAQ 100 Index shows a broad topping chart pattern which suggests that a sharp downwards move is coming. This moment might be about to arrive, as last week’s close was very near the low of its weekly range, and it was the lowest close seen in this Index since April. Another factor is that the price moved up into its current area very quickly, so there is no technical reason why it cannot also fall back to where it came from very quickly.
Earlier this year, we saw a massive AI boom which has seen AI and chip stocks make extremely huge gains within just a few months. This sector looks very overbought and could drag the entire tech sector and even the whole stock market down with it.
I don’t like to short equity indices, especially not US equity indices, but I can see this Index falling by quite a lot more, and when that downwards move stabilizes, there could be a buying opportunity, possibly at 26,000 or even 23,000.
If you have been long here for a while, it might be smart to consider taking profit.
NASDAQ 100 Index Weekly Price Chart
Gold
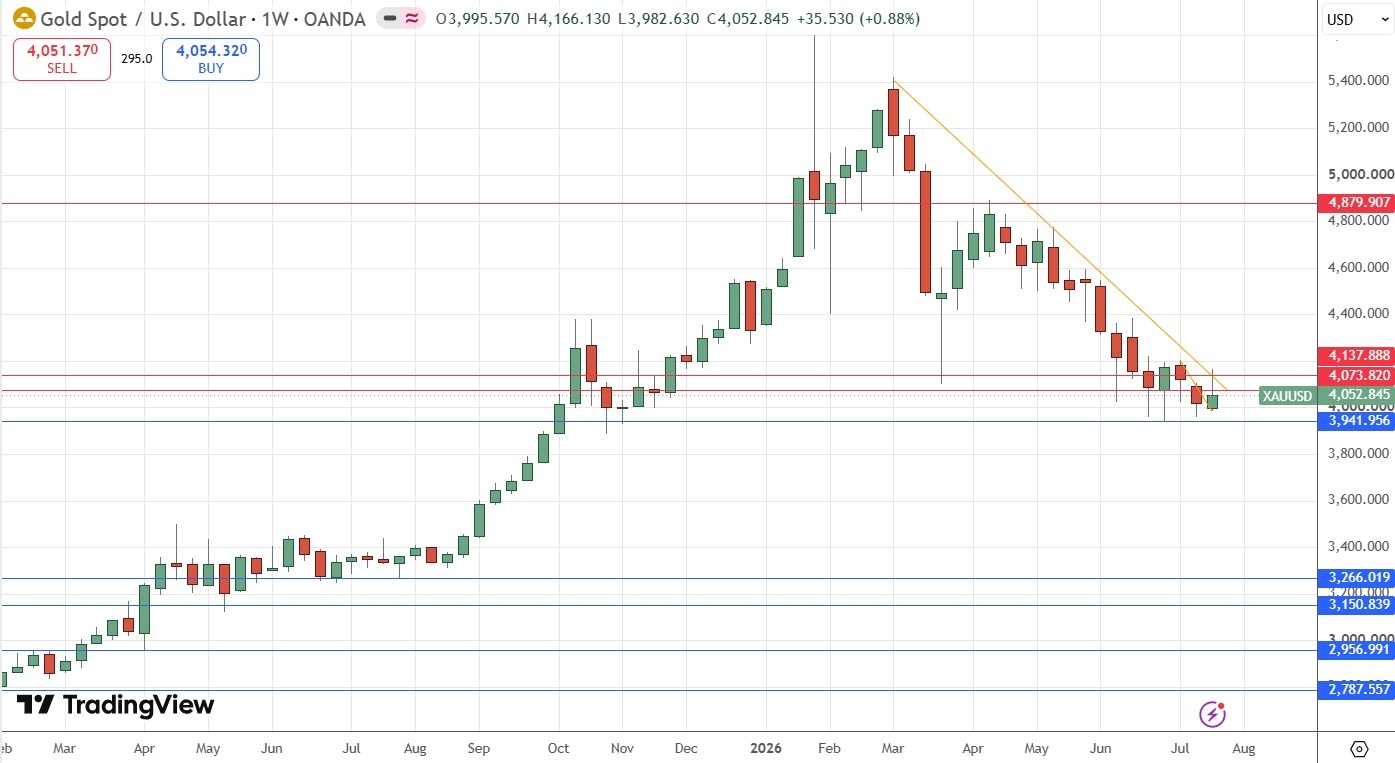
Gold attempted to rise last week but failed at the descending trend line shown in the price chart below, which was confluent with the key resistance level at $4,138. This trend line has been running ever since this precious metal made a peak early last March.
If you are thinking of buying, it will likely be wiser once the trend line and more importantly resistance level which I mentioned is decisively broken.
I do not short commodities, but if I did, a short here would be attractive to me once the price closed with a strong bearish daily candlestick at a new multi-month low price. Until the Fed changes their hawkish rhetoric on inflation, I doubt Gold will be able to make a serious upwards move.
Gold Weekly Price Chart
WTI Crude Oil Futures
WTI Crude Oil had its third consecutive up week, after reaching key support at $67.11 four weeks ago which is classic “stairstep” support as it previously acted as resistance. This was the area the price was trading in before the USA / Iran war started on 28th February earlier this year.
The ceasefire between the USA and Iran continued to deteriorate even further last week, with reports that the US administration has grown so frustrated with Iran’s refusal to make a meaningful deal that it was considering even stronger strikes on Iran than it conducted during the war earlier this year. These strikes were widely expected to begin yesterday, but the moment passed, with sources saying that Trump wants to pursue diplomacy for a while longer. It might be that the real reason is that the USA needs more time to build up its stocks of military equipment.
The Strait of Hormuz is apparently effectively closed according to publicly available information, which will keep the price of Crude Oil generally elevated, but the fact that the USA did not strike over the weekend means that the price will likely open lower this week. However, I find it hard to believe that President Trump, who has been chasing a “good deal” with Iran for four months will, will get enough from Iran to persuade him to truly call it off. The resumption of the war with full force has likely just been postponed.
I am not sure how much higher the price will go if and when that happens, because when Trump decides it has gone too high he might suddenly reverse course or make some declaration which could send the price suddenly lower, so it might be dangerous to trade.
Taking any trades here might best be done by day trading, so you are in the market for only a short time. I think after the initial drop, the price will rise again later in the coming week.
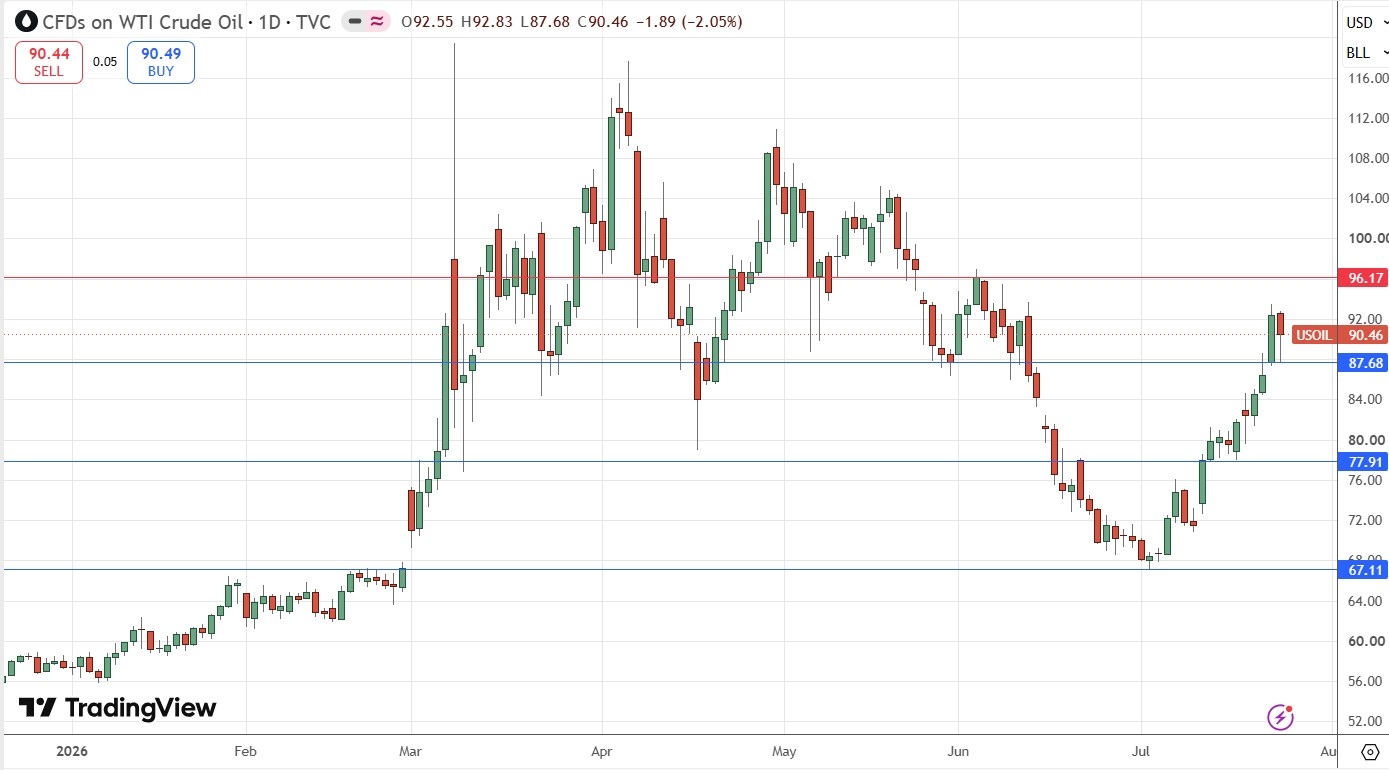
WTI Crude Oil Spot Daily Price Chart
Bottom Line
I see the best trades this week as:
-
Long of the USD/JPY currency pair.
-
Short of the EUR/USD currency pair.

