We have reached a milestone in the GBP/USD currency pair – possibly a decisive one – following the strong, long-term bullish breakout yesterday. While the price action remains well within its longer-term range, the bullish case may finally be becoming increasingly convincing for several solid reasons, both fundamental and technical.
Of course, it is worth noting that the price hasn’t gone anywhere that it wasn’t just a few months ago, and that there are arguments that a very long-term range is holding. Yet these arguments are certainly becoming weaker by the day.
GBP/USD Breakout Gains Fundamental Support
A breakout in a Forex currency pair such as the GBP/USD doesn’t necessarily mean much at all, but when there is a lot going on to support it, it is worth paying closer attention. We arguably are in such a situation now.
Yesterday saw a new factor which supported this bullish case. Firstly, yesterday saw the US Treasury step in to support the long end of its bond market, and this hammered the US Dollar. The US Dollar Index is now trading near its three-month low after falling sharply yesterday, continuing the dominant bearish trend in the greenback.
A pre-existing factor adding to the breakout’s relevance is yesterday’s relatively high but not unexpected UK CPI (inflation) print this morning just before the London session got underway.
GBP/USD Technical Analysis: 1.3600 Holds as 1.3658 Nears
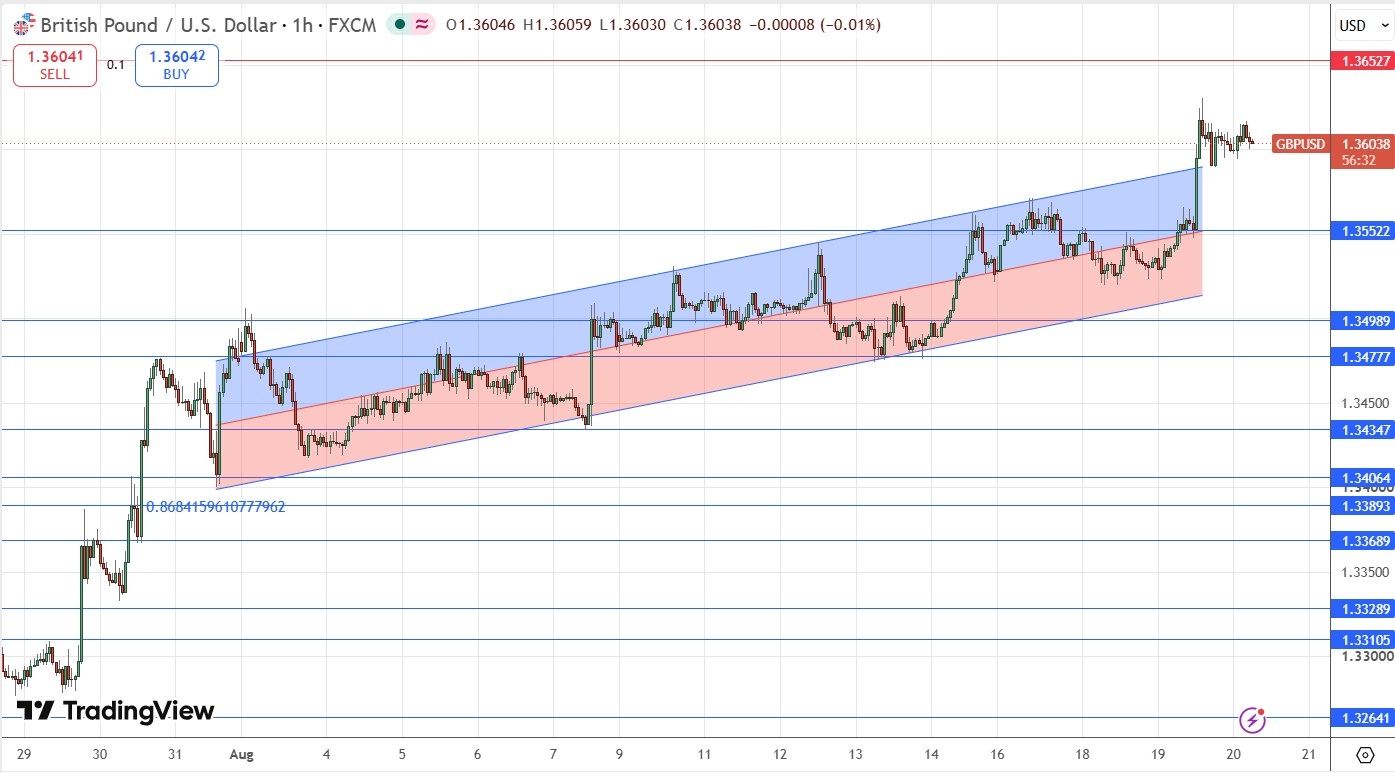
Yesterday saw the price make a strong bullish breakout to reach a new three month high above 1.3630. The price has retreated a little but was still trading above the round number at 1.3600 late in the Asian session. These are bullish price actions. The six month high at 1.3658 is within sight and could easily be reached or even exceeded today.
The breakout was accompanied by two key bullish technical developments: the simultaneous breakout from the ascending bullish price channel, indicated within the price chart below by the linear regression analysis study which had held for almost three weeks; and the flipping of the key long-term resistance level at 1.3553 to become new obvious support, evidenced by the price basing at that level early in yesterday’s London session.
What a Break Above 1.3658 Could Mean
The price has been consolidating, mostly above the round number at 1.3600, since yesterday’s New York session. This kind of price action after a strong advance often signifies a further move higher is imminent. The nearest overhead resistance level is 1.3653 and just a few pips above that lies the six-month high price. A break beyond that would effectively see the price trading in blue sky which could mean an unusually rapid rise.
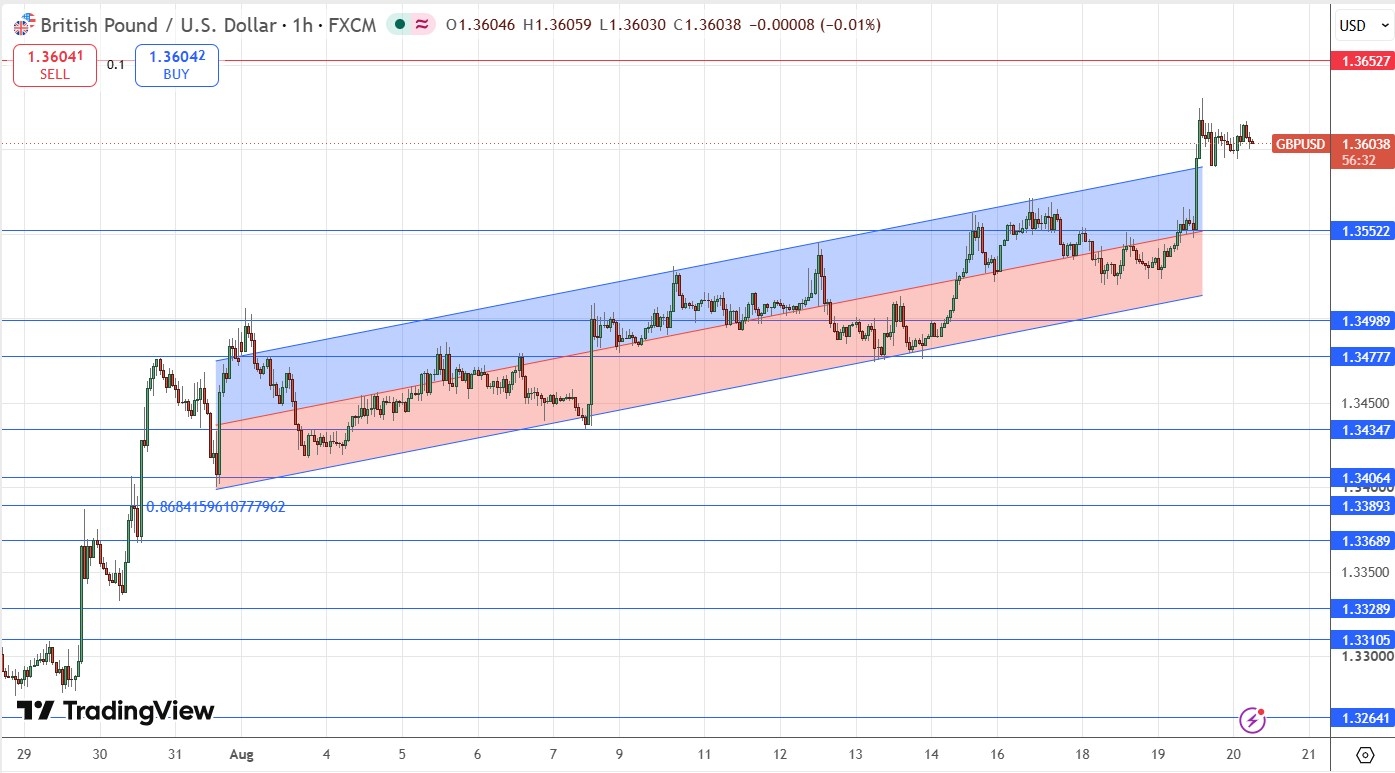
GBP/USD H1 Price Chart
GBP/USD Downside Risks: Fed Hawks and a 1.3552 Retest
While there are compelling reasons to see a bullish outlook, there are fundamental, sentimental, and even technical factors that could work against that which are worth considering.
Last night’s release of the minutes of the most recent FOMC (Federal Reserve) meeting showed that the three dissenting votes in favour of a rate hike were a bloc vote, meaning that there is now clearly a hawkish bloc pushing for a more hawkish interest rate. More importantly, the minutes indicated that there is some agreement with other members who may be prepared to join them soon. If more members begin making public comments more supportive of a rate hike, this will tip the odds in favour of a sooner rate hike, which would likely strengthen the US Dollar, and put bearish pressure on the rate of the GBP/USD.
Let’s not forget the British Pound, which is supported by a relatively high interest rate and inflation rate. If any cracks arise in that picture, we could also see bearish pressure.
Finally, there is a general tendency in the Forex market for prices to revert to a mean which might work against a further quick advance.
Instead of the price continuing to rise and test or even break out beyond the six-month high, we might see a pullback to the new support level at 1.3552. It is also possible that the current area of price action supported just below the round number at 1.3600 might hold, although if that happens, it will suggest higher prices. Finally, we might see the price break down below 1.3552 or even the round number at 1.3500. The former scenario would be somewhat bearish, but a sustained break below 1.3500 could really turn the picture around from a long-term bullish breakout with traders jumping on the bandwagon, to a quick flop back into the long-term range.
Key GBP/USD Levels to Watch Today
There are some pivotal levels I outlined above which are likely to be psychological “lines in the sand” worth watching, which will indicate sentiment. These could be potential buying points, or even selling points, depending upon the price action. It is worth remembering that a traditionally volatile Forex pair like this one tends to be driven by short-term momentum, which can turn very easily, and the early part of the London session has historically tended to also provide some clues about the day’s direction. How the price behaves today might reveal whether we are really in new territory or not.
Ready to trade our GBP/USD analysis? Here is our list of the best Forex brokers worth checking out.