Date: 13 August 2026
Apple launches new US manufacturing plant
According to a report by CNBC, Apple Inc. has opened a new manufacturing plant in the United States, specifically located in Houston, Texas. This initiative follows mounting pressure from the current US administration, which is advocating for increased domestic investment by American firms—particularly those involved in artificial intelligence and advanced technology development. In this context, Washington aims to safeguard US innovation through patents, ensuring high-tech processes are not disclosed in foreign jurisdictions where US companies establish off-shore facilities.
Apple releases a solid quarterly report
Apple Inc. published a strong quarterly financial report on 29 July, surpassing market expectations for both total revenue and earnings per share (EPS). The technology giant reported revenue of $109.42 billion, exceeding the market consensus forecast of $108.86 billion. Concurrently, the company posted earnings per share of $2.02, topping the estimated $1.89. These results represent a year-on-year (YoY) revenue growth rate of 16.35% and a YoY increase in EPS of 28.7%.
Nevertheless, despite these solid financial results, Apple’s share price has declined by approximately 9% since the release. This pullback reflects intense scrutiny from market participants regarding technology equities; despite companies reporting robust fundamentals, share prices have experienced contractions as investors currently reward only significant upside surprises.
Financial overview of Apple Inc.
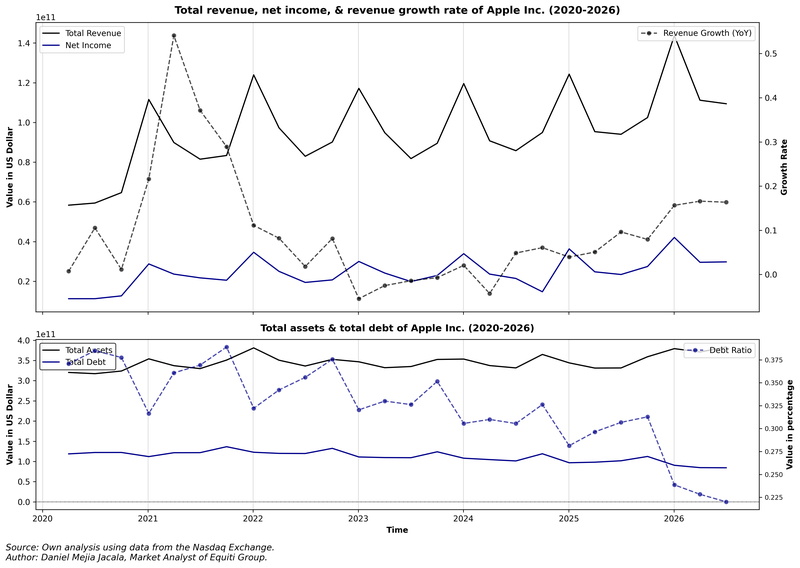
Apple’s revenue performance has demonstrated solid growth over the past six years. The average revenue growth rate stands at 9.5%, exhibiting an upward trajectory since Q1 2024. In turn, the net income growth rate has averaged approximately 17%, indicating that Q2 2026 earnings performance exceeded historical averages. Furthermore, Apple’s average net margin remains at approximately 25%, highlighting consistent profitability and strong capital efficiency.
Meanwhile, total asset values have continued to expand, while the debt-to-assets ratio decreased to 22% in Q2 2026. This deleveraging trend points to reduced balance sheet risk alongside robust investment activity and revenue performance.
Figure 1. Apple’s Revenue, Net Income, Total Debt, & Total Assets (2020–2026). Source: Own analysis using data from the Nasdaq Exchange.
Technical analysis of Apple’s shares
From a technical perspective, Apple’s share price maintains a long-term bullish channel pattern. Primary structural observations include:
- Trend Context: On longer-term timeframes, Apple preserves a market structure defined by a consistent sequence of higher highs and higher lows. The price continues to trade comfortably above its 100- and 200-day Simple Moving Averages (SMAs), confirming underlying trend strength.
- Resistance Levels: Should buying volume push price action above immediate resistance at $315, the next critical level sits at $340—the record high. A decisive breakout and close above these zones would likely initiate a new expansionary phase into uncharted price discovery zones.
- Support Levels: If immediate support at $300 fails to hold, the primary structural floor is identified at $280—a level where the 200-day SMA converges with the lower boundary of the long-term bullish channel. A failure to defend the $280 level would significantly increase the probability of a deeper market correction.
- Momentum indicators: Both the Moving Average Convergence Divergence (MACD) and the Relative Strength Index (RSI) are currently trending downwards, suggesting that short-term bearish momentum could persist. Notably, both indicators exhibit bearish divergences, reinforcing the hypothesis of a potential short-term correction.
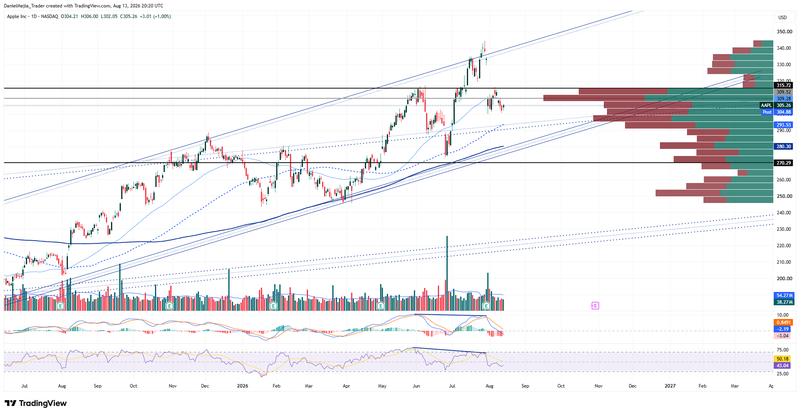
Figure 2. Apple’s Share (2025–2026). Source: Data from the Nasdaq Exchange; Own analysis conducted via TradingView.