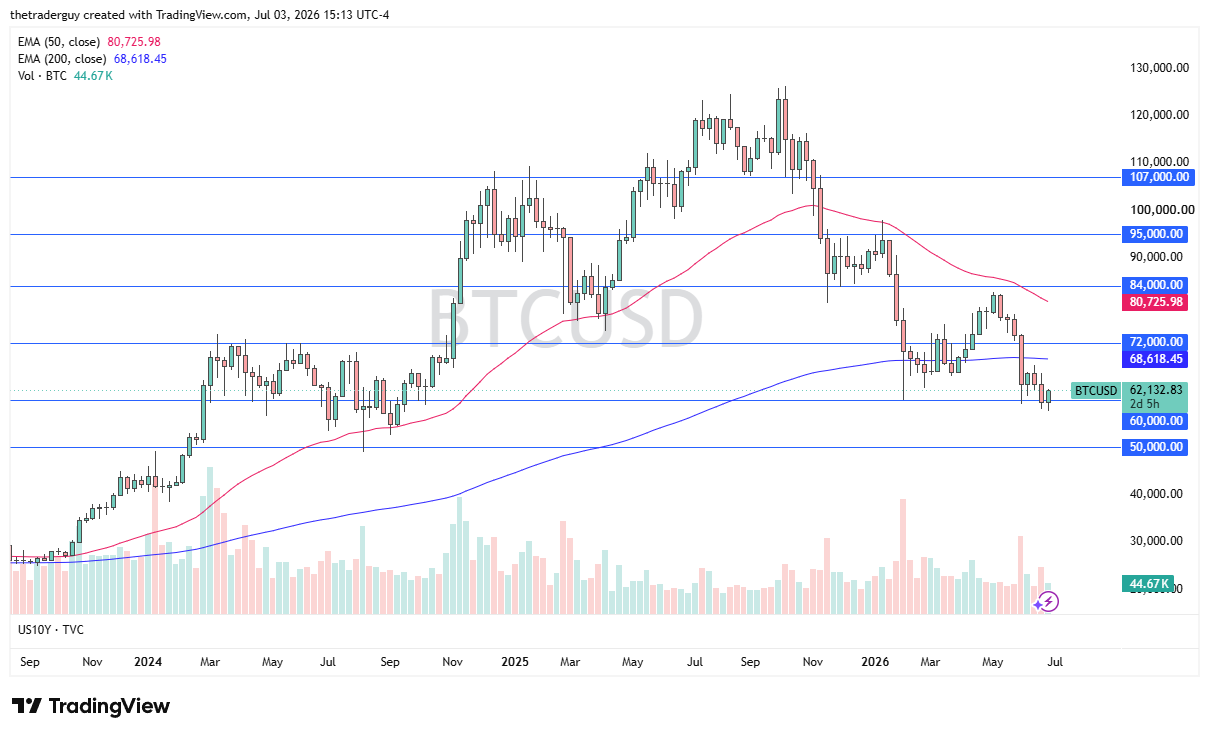
Bitcoin has rallied during the course of the trading week to show signs of life as the $60,000 level is offering a bit of support. That being said, I am a little bit cautious about getting long Bitcoin at the moment due to the fact that it has been so beaten down.

Ultimately, I think that if we do rally from here, you still have to keep an eye on selling pressure until you get well above the $65,000 level. If we turn around and break down below the bottom of the weekly candle that we just printed, that opens up the possibility of 50,000 being targeted.
The Euro has spent most of the week going back and forth, but all things being equal, the 1.14 level is an area that people will be watching, generally speaking, for the idea of support. The week has seen a little bit of a turnaround in the sense that the non-farm payroll announcement came out weaker than anticipated, and people started to trim bets on the Federal Reserve raising rates.

That being said, if we can break down below the bottom of the weekly candlestick from the previous week, I think that opens up a move to the 1.12 level. Rallies at this point in time, I still look at with suspicion until we can cleanly clear the 1.15 level, perhaps on a daily close.
The New Zealand dollar rallied most of the week, but it is showing signs of exhaustion on Friday. I think this is a pair that if we do see US dollar strength overall, the New Zealand dollar might be a place where we see it pretty quickly.

This is a market that has been in a range for a long time, but I would also point out that the scenario in New Zealand is much different than many other places, as the central bank in Wellington has not been exactly hawkish. So, with that, I like the idea of getting short on signs of exhaustion sometime this week, and it is probably worth noting that the Friday candlestick is looking a bit like a shooting star, so keep that in the back of your mind.
The US dollar has been sideways against the Canadian dollar for the week, and I think we may be getting a little stretched at this point. Ultimately, though, I recognize that this is a market that will remain fairly noisy and perhaps very erratic due to the fact that the two economies are so heavily intertwined.

The Canadian economy seems to be struggling, and despite the fact that we had that weaker-than-anticipated jobs report on Thursday, I think you still have to believe this is a market that favors the US dollar. So, if we do get that little bit of a pullback, it will probably invite buying, especially if we get anywhere near the 1.40 level.
The British pound has been very strong for the week as we have broken above the 1.33 level. We are now challenging the 50-week EMA, and if we can break above the candlestick for this past week, ostensibly the 1.34 level, it opens up the possibility of a move to the 1.35 level.

We have been in a range for a while, so the fact that we have turned around to show signs of life is not a huge surprise, and keep in mind that the British pound itself has been a little bit more resilient against the US dollar in general. I think if the US dollar starts to sell off, then it makes a certain amount of sense that you would see the pound be one of the main beneficiaries. Even if the US dollar strengthens, I would not be interested in shorting this particular pair.
Silver is seeing a lot of noisy behavior, and I think, all things being equal, the $60 level is a large, round, psychologically significant figure that is offering a little bit of a barrier.

But quite frankly, we have recently made a new swing low, so I think any rally at this point in time that shows signs of exhaustion will be a selling opportunity. The 50-week EMA is sitting right around the $64.36 level, and I think that is your upside barrier at the moment.
Gold looks fairly well as we have turned around over the last couple of weeks, and now it looks like if we can break above the 50-week EMA, we could go looking to the $4,400 level.

If we turn around and break down below the $3,900 level, then the market will go looking to the $3,500 level. Ultimately, this is a market that is trying to find its bottom. Pay attention to the US dollar; if it starts to weaken, that could help gold, but we will have to wait and see if that really plays out.
The Nasdaq 100 rallied for the bulk of the week, but keep in mind we were not open on Friday. The candlestick is a little distorted in the sense that the Thursday session was a non-farm payroll announcement, and we did, of course, get pretty bad news, but it is not fatal.

Ultimately, I think we are looking at a market that will more likely than not continue to go sideways based on just simple consolidation after a huge move to the upside over the last couple of months. I like the idea of buying dips; I think we will get that opportunity.
Ready to trade our Forex weekly forecast? We’ve shortlisted the best forex trading accounts to choose from.