Bearish view
-
Sell the BTC/USD pair and set a take-profit at 60,000.
-
Add a stop-loss at 67,000.
-
Timeline: 1-2 days.
Bullish view
-
Buy the BTC/USD pair and set a take-profit at 67,000.
-
Add a stop-loss at 66,000.
Bitcoin price remained on edge today, falling for four consecutive days, and reaching its lowest level since August 4. The BTC/USD pair was trading at 63,515 as traders wait for the latest US consumer price index (CPI) report. It has slumped by double digits from its all-time high.
Bitcoin has struggled as signs that demand was fading. Data shows that Bitcoin’s futures open interest has dropped in the past few days. That is a sign that activity in the futures market has stalled in this period.
Bitcoin ETFs have also lost momentum. After adding over $800 billion in assets last week, these funds have lost assets this week as investors have embraced a risk-off sentiment amid the ongoing US-Iran crisis. Crude oil prices jumped, with Brent crossing the important resistance level of $90.
US stocks retreated, with the Dow Jones falling by over 184 points. A key concern is that the ongoing war will push inflation higher, pushing the Federal Reserve to hike interest rates either this year and in 2027. Bitcoin tends to underperform the market when the Fed is hiking interest rates.
Bitcoin also struggled as Strategy and other companies continued selling their coins. Strategy has sold coins worth millions of dollars in the past few weeks, and this trend may continue as it boosts its cash reserves.
Other top companies, including mining firms like MARA and Riot Platforms have also sold some of their coins to boost their cash reserves. That’s because these companies are now pivoting to the booming data center business. Just this week, Riot Platforms reached a $9 billion deal with Anthropic.
BTC/USD Technical Analysis
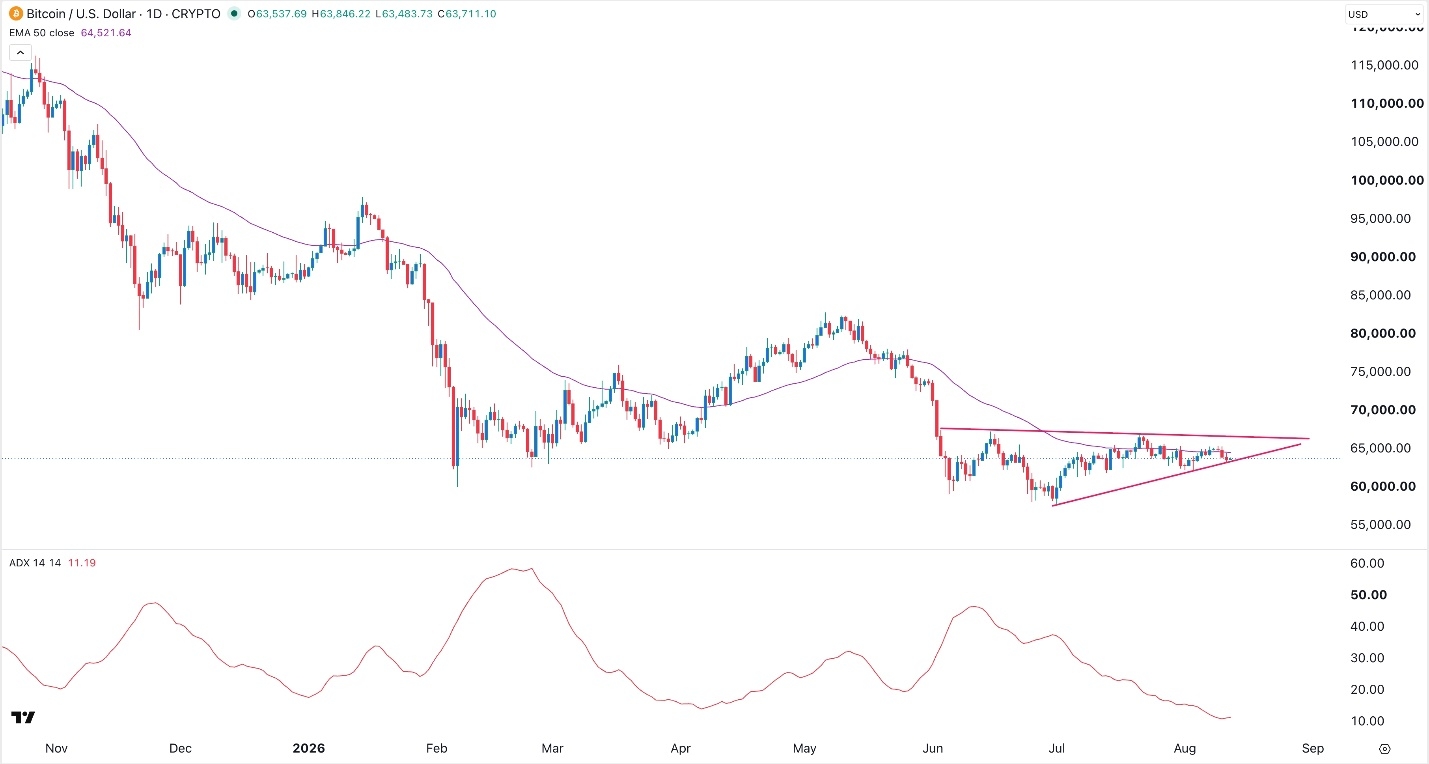
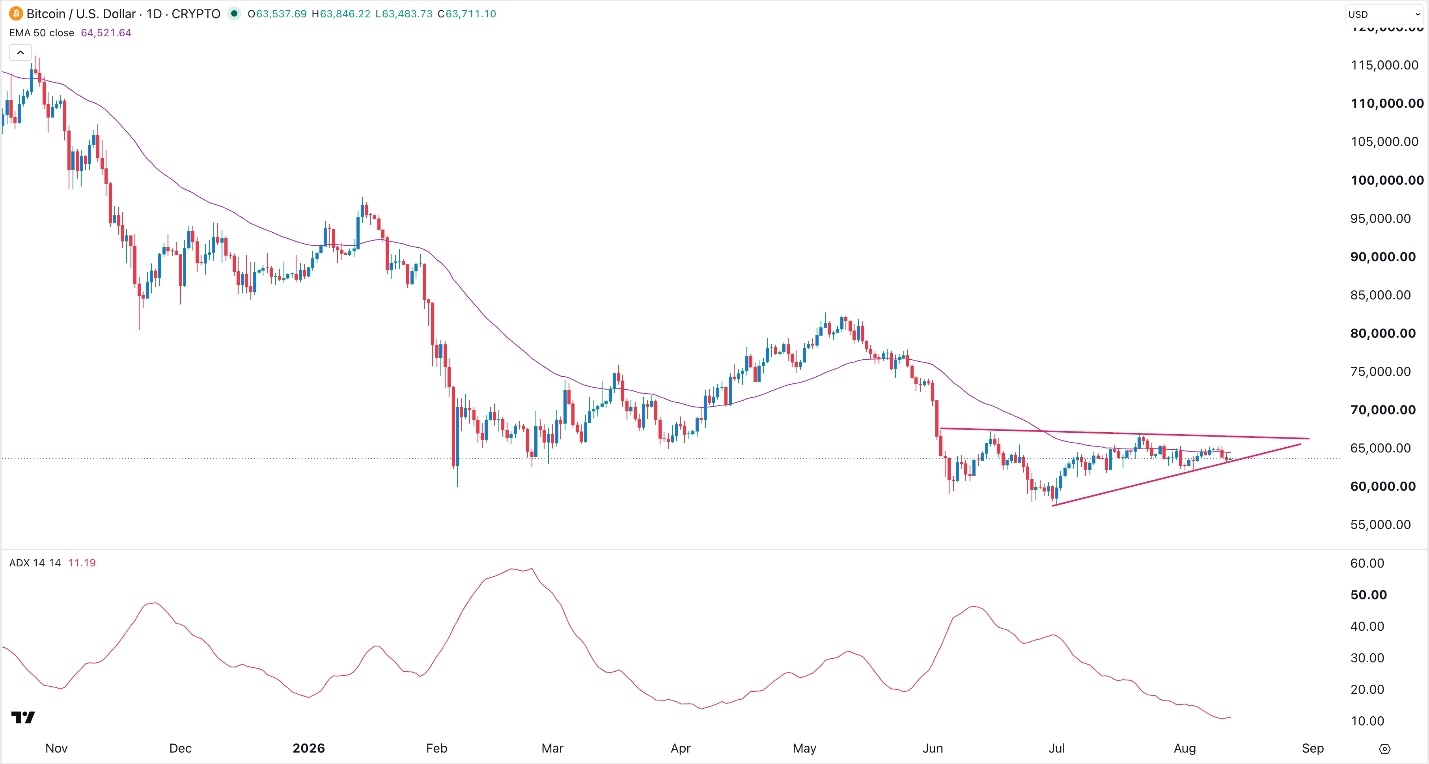
The daily chart shows that the BTC/USD pair has retreated in the past few days as demand has waned. It remains below the descending trendline that links the highest swing since June 15 this year. It has dropped below the 50-day Exponential Moving Average (EMA).
The Average True Range (ATR) has slipped, while the spread of the three lines of the Bollinger Bands has narrowed. Therefore, the pair will likely remain in a narrow range in the coming days and then either break out or break down. The key support and resistance levels to watch will be at 60,000 and 67,000.
Ready to trade our daily Forex signals? Here’s a list of some of the best crypto brokers to check out.
Crispus Nyaga is a Technical Analyst at DailyForex with more than eight years of experience as a financial analyst, coach, and trader. He specializes in technical analysis of major currency pairs and cryptocurrencies, using chart patterns, trend structure, and key indicators to frame trading scenarios for Forex and digital asset markets. Crispus has worked with well-known brokers including ATFX, easyMarkets, and OctaFX, and his market commentary has been published widely on platforms such as Seeking Alpha, InvestingCube, Capital.com, and Invezz.
As seen on: SeekingAlpha, Macrostreet.com, Invezz.com, Forbes, Investing.com, Marketwatch, Crypto.news