Also:
- Trump’s overall approval continues decline, down to 38%
- His approval on handling the economy sinks to 30%, and to 22% on inflation and the cost of living
- 95% say gas prices are up, with 19% approving of how Trump is handling them
- 18% say the U.S. has achieved its goals in Iran and 28% say the war has been worth the cost
- Public now says Democrats are better able to handle the economy and inflation than Republicans
- Democratic lead shrinks on generic congressional ballot
A new Marquette Law School Poll national survey finds that President Donald Trump retains strong influence with voters in Republican primary elections, as seen in recent primaries in Indiana, Louisiana, Kentucky, and Texas, where Trump-backed candidates defeated Republican incumbents opposed by Trump. Among all Republicans, 71% said they would vote for a primary candidate Trump endorsed, while 20% would vote for an incumbent Republican Trump opposed.
But the poll finds that Trump’s overall support continues to decline, as does support of his positions on some major issues.
Trump’s influence is greatest with Republicans who are favorable to the MAGA movement, 87% of whom would vote for a Trump endorsed primary candidate, while just 9% would vote for a Republican incumbent Trump opposed. In contrast, among the 28% of Republicans who are not favorable to MAGA, 30% would vote for the Trump-supported primary candidate and 48% would vote for the Republican incumbent opposed by Trump. An additional 22% say they would not vote in such a GOP primary, thus further enhancing Trump’s electoral impact.
Trump’s influence within the Republican electorate is also seen in his job approval. Among the 72% of Republicans favorable to MAGA, 93% approve of the job Trump is doing as president, while among the 28% of Republicans not favorable to MAGA, Trump’s approval falls to 36%.
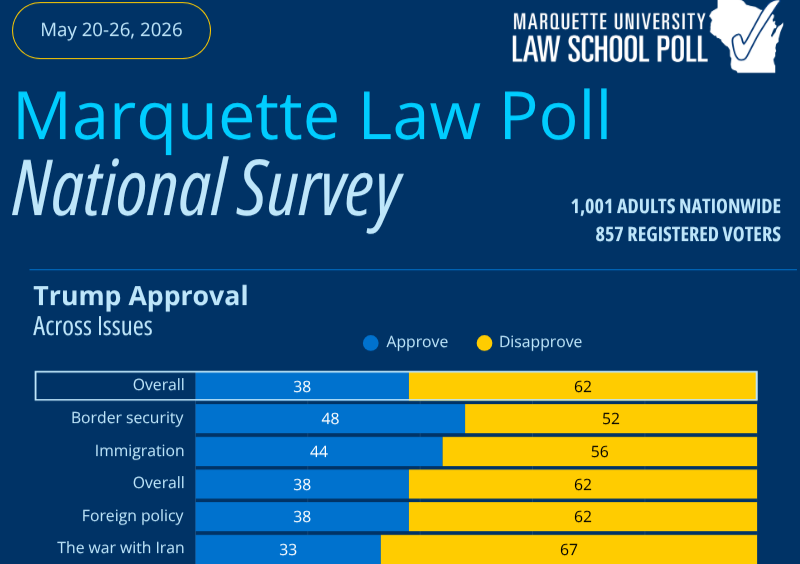
The survey was conducted May 20-26, 2026, interviewing 1,001 adults nationwide, with a margin of error of +/-3.4 percentage points. For Republicans, the sample size is 413, with a margin of error of +/-5.3. For Democrats, the sample size is 435, with a margin of error of +/-5.2. For registered voters, the sample size is 857, with a margin of error of +/-3.6. For likely voters, the sample size is 576, with a margin of error of +/-4.4 percentage points.
Attention to news about recent GOP primaries with Trump-endorsed challengers to Republican incumbents is not notably high, with 29% saying they heard or read a lot about these primaries. Among all Republicans, 29% heard a lot, 34% heard a little, and 38% heard nothing at all. Attention was slightly higher among MAGA Republicans, 31% of whom heard a lot, compared to 23% among non-MAGA Republicans. Democrats were more likely to say they heard a lot about these primaries than were Republicans, as shown in Table 1. (All results in the tables are stated as percentages.)
Table 1: Attention to GOP primary outcomes, by party identification & MAGA
Among adults
| Party & MAGA | Attention to GOP primaries | ||
| A lot | A little | Nothing at all | |
| Among all adults | 29 | 34 | 37 |
| Republican, MAGA | 31 | 35 | 34 |
| Republican, Non-MAGA | 23 | 29 | 47 |
| Independent | 15 | 34 | 51 |
| Democrat | 35 | 34 | 31 |
| Marquette Law School Poll, national survey May 20-26, 2026 | |||
| Question: [Republican incumbents who Trump opposed were defeated in Republican primaries in Indiana, Louisiana and Kentucky by candidates Trump endorsed] Here are some recent topics in the news. How much have you heard or read about each of these? | |||
Trump’s strength within the Republican electorate contrasts with his declining approval among all adults. In this May poll, 38% approve of how he is handling his job as president, while 62% disapprove, a net approval of -24 percentage points. At the start of his second term as president in February 2025, 48% approved and 52% disapproved, for a net approval of -4 percentage points. The decline in approval has been small from month-to-month but has been steady over the past 16 months. This has led to a cumulative decline in net approval of 20 points, as shown in Table 2.
Table 2: Trump job approval in second term
Among adults
| Poll dates | Net approve minus disapprove | Approve | Disapprove |
| 5/20-26/26 | -24 | 38 | 62 |
| 4/8-16/26 | -21 | 39 | 60 |
| 1/21-28/26 | -16 | 42 | 58 |
| 11/5-12/25 | -14 | 43 | 57 |
| 9/15-24/25 | -14 | 43 | 57 |
| 7/7-16/25 | -10 | 45 | 55 |
| 5/5-15/25 | -8 | 46 | 54 |
| 3/17-27/25 | -8 | 46 | 54 |
| 1/27-2/6/25 | -4 | 48 | 52 |
| Marquette Law School Poll, national surveys, latest: May 20-26, 2026 | |||
| Question: Overall, how much do you approve or disapprove of the way Donald Trump is handling his job as president? | |||
Approval of Trump’s handling of specific issues illustrates both relative strength and relative weakness, with net approval ranging from -4 for handling of border security to -62 for handling of gasoline prices. The best issues for Trump are border security and immigration, though both are now net negative in approval. This May survey is the first time border security has been in negative territory in the second term, down from a net +5 in April, while net approval on immigration was unchanged since April.
Approval of handling the economy slipped to 30% in May, down from 32% in April, and approval of Trump’s handling of inflation slipped to 22% from 24% in April. Approval on handling gasoline prices is 19% in May, with 81% disapproving. This is the first time the poll asked specifically about gasoline prices. Handling of the war with Iran receives a 33% approval rating and handling of tariffs 32% approval, both lower than Trump’s overall approval rating of 38%. Approval across all issues is shown in Table 3.
Table 3: Trump job approval across issues
Among adults
| Issue | Net approve minus disapprove | Approve | Disapprove |
| Border security | -4 | 48 | 52 |
| Immigration | -12 | 44 | 56 |
| Overall | -24 | 38 | 62 |
| Foreign policy | -24 | 38 | 62 |
| The war with Iran | -34 | 33 | 67 |
| Tariffs | -35 | 32 | 67 |
| The economy | -40 | 30 | 70 |
| Inflation/cost of living | -56 | 22 | 78 |
| Gasoline prices | -62 | 19 | 81 |
| Marquette Law School Poll, national survey, May 20-26, 2026 | |||
| Question: Overall, how much do you approve or disapprove of the way Donald Trump is handling his job as president? | |||
| Question: Overall, how much do you approve or disapprove of the way Donald Trump is handling each of the following issues? | |||
Trump’s approval within partisan categories also varies considerably across issues. Among Republicans, approval ranges from 87% for his handling of border security to 45% for inflation and 38% for gasoline prices. Among independents, approval on border security reaches 40% and 33% on immigration, while all other issues have approval ranging from 22% for foreign policy down to 7% for inflation and 6% for gasoline prices. Democratic approval is in single digits for all issues except border security at 13%. The full results are shown in Table 4.
Table 4: Trump job approval across issues, by party identification
Among adults
| Issue | All adults approve | Rep approve | Ind approve | Dem Approve |
| Border security | 48 | 87 | 40 | 13 |
| Immigration | 44 | 85 | 33 | 9 |
| Overall | 38 | 77 | 16 | 7 |
| Foreign policy | 38 | 74 | 22 | 8 |
| The war with Iran | 33 | 67 | 16 | 6 |
| Tariffs | 32 | 69 | 12 | 5 |
| The economy | 30 | 60 | 16 | 5 |
| Inflation/cost of living | 22 | 45 | 7 | 4 |
| Gasoline prices | 19 | 38 | 6 | 4 |
| Marquette Law School Poll, national survey, May 20-26, 2026 | ||||
| Question: Overall, how much do you approve or disapprove of the way Donald Trump is handling his job as president? | ||||
| Question: Overall, how much do you approve or disapprove of the way Donald Trump is handling each of the following issues? | ||||
In the 12 months since May 2025, approval of Trump has declined on every issue and in every partisan category. Among Republicans, there have been declines of 5 percentage points or less on border security, immigration, and tariffs. Larger declines in approval among Republicans include 9 points on foreign policy and 10 points on overall Trump job approval. The largest Republican drops in approval are 20 points on the economy and 23 points on handling inflation and the cost of living.
Among independents during the past year, moderate decline in approval is seen for immigration (down 5 points), border security (down 7), and foreign policy (also down 7). Two issues have declined by 14 points each, tariffs and the economy, with overall approval down 15 points. The largest drop in approval is for handling inflation, which is down 16 points.
Among Democrats, no issue has declined by much because Democrats have given mostly single digit approvals throughout the year, leaving little room for decline. The one exception is border security, where approval fell 10 points. The comparison of approval from May 2025 to May 2026 by party is shown in Table 5.
Table 5: Trump job approval across issues, by party identification, May 2025-May 2026
Among adults
| Poll dates | Rep approve | Ind approve | Dem Approve |
| Border security | |||
| 5/5-15/25 | 92 | 47 | 23 |
| 5/20-26/26 | 87 | 40 | 13 |
| Immigration | |||
| 5/5-15/25 | 90 | 38 | 13 |
| 5/20-26/26 | 85 | 33 | 9 |
| Overall | |||
| 5/5-15/25 | 87 | 31 | 8 |
| 5/20-26/26 | 77 | 16 | 7 |
| Foreign policy | |||
| 5/5-15/25 | 83 | 29 | 8 |
| 5/20-26/26 | 74 | 22 | 8 |
| Tariffs | |||
| 5/5-15/25 | 71 | 26 | 5 |
| 5/20-26/26 | 69 | 12 | 5 |
| The economy | |||
| 5/5-15/25 | 80 | 30 | 8 |
| 5/20-26/26 | 60 | 16 | 5 |
| Inflation/cost of living | |||
| 5/5-15/25 | 68 | 23 | 4 |
| 5/20-26/26 | 45 | 7 | 4 |
| Marquette Law School Poll, national surveys, latest: May 20-26, 2026 | |||
| Question: Overall, how much do you approve or disapprove of the way Donald Trump is handling his job as president? | |||
| Question: Overall, how much do you approve or disapprove of the way Donald Trump is handling each of the following issues? | |||
Most important issues
As has been the case in all seven Marquette national polls since March 2025, inflation and the cost of living is the issue that matters most to the public, with 37% citing it as most important. But concern has increased since April, when 30% listed inflation as most important, and is back to the higher level seen in January (38%). Concern over the war with Iran declined from April, when it was the top issue for 24%, to May, when 16% named it as the top issue. The percentage saying “immigration and border security” is most important declined from 14% in January to 6% in May. Other issues have remained in single digits since January. Table 6 shows the full set of issue concerns from January through May.
Table 6: Most important issue
Among adults
| Issue | |||
| May | April | January | |
| Inflation and the cost of living | 37 | 30 | 38 |
| The economy | 19 | 15 | 17 |
| The war between Iran, Israel, and the United States | 16 | 24 | NA |
| Medicare & Social Security | 7 | 6 | 9 |
| Immigration and border security | 6 | 7 | 14 |
| Health care | 5 | 5 | 8 |
| Crime | 2 | 3 | 2 |
| The size of the federal deficit | 2 | 3 | 3 |
| Abortion policy | 2 | 2 | 3 |
| The war between Russia and Ukraine | NA | NA | 1 |
| Marquette Law School Poll, national surveys, latest: May 20-26, 2026 | |||
| Question: Which one of the following issues matters MOST to you right now? | |||
War with Iran
Among the public, 18% say the United States has achieved its goals in the war with Iran, while 81% say it has not achieved those goals. In April, 21% said the goals had been achieved.
The reasons for the war remain unclear to the public, with 38% who say there was sufficient reason to launch the war and 61% who say there was not sufficient reason. In April, 36% thought there was sufficient reason for the war and 63% did not think so.
The ceasefire, which has now stretched on for more than 7 weeks, remains popular, with 70% approving and 29% disapproving. In April, 75% approved.
During the ceasefire, Trump has sometimes threatened to resume the bombing of Iran. This is not a popular option, with 77% saying the bombing should not resume and 23% favoring a resumption of attacks.
There are considerable partisan differences concerning resuming air attacks. Among Republicans, 44% favor resumption of bombing, while 15% of independents and 5% of Democrats favor renewing attacks. There is more support among MAGA Republicans for new bombing, 52%, while among non-MAGA Republicans, only 25% support new bombing. As for the cost of the war, 28% say the war has been worth the cost, and 72% say it has not been worth it. Fifty-seven percent of Republicans say the war has been worth the cost, while 43% say it has not been worth it. Only 11% of independents and 5% of Democrats say the war has been worth the cost.
Gas and grocery prices and the economy
The public is well aware of increasing gas prices since the Iran war began, with 95% saying gas prices have increased over the last six months, 3% saying they have held steady, and just 2% saying prices have declined. In April, 93% said gas prices had increased over the previous six months. This is in sharp contrast with the view of gas prices in January, when 50% said the price of gas had gone down over the previous half year, with 21% saying the price had gone up.
There is very little partisan difference in the perception of gas prices, with 93% of Republicans, 95% of independents, and 96% of Democrats saying prices have increased.
In addition to rising gasoline prices, 85% say the cost of groceries has gone up over the last six months, an increase from 70% in January. Grocery prices are said to be stable by 11%, and 4% say they have declined. In January, 11% thought their grocery bill was down.
Seventy-three percent of Republicans say grocery prices are up, compared to 90% of independents and 95% of Democrats
Opinion about the state of the economy also worsened since January. In May, 26% say the economy is excellent or good, down from 35% in January. Thirty percent say it is poor, up from 25% in January. The economy is seen as not so good by 45% in May, up from 40% in January.
The outlook for inflation over the next year has also worsened. In May, 71% think inflation will increase, up from 61% in January. Sixteen percent think inflation will stay about the same, and 13% think it will decrease.
The percentage of people who say they personally are better off than a year ago fell to 19% in May. It was 28% in January. Those saying they are worse off rose to 41% from 34%, and those saying things are about the same for them was 39% in May, close to the number in January, 37%.
Trump handling of inflation
Confidence that Trump’s policies will decrease inflation has fallen by nearly half since December 2024, the month after he was reelected. At that time, 41% thought his policies would lower inflation, but in May 2026, only 22% think this. At the end of 2024, 45% thought his policies would increase inflation, while in the current poll 61% think his policies are driving inflation up. Another 18% say his policies don’t affect inflation, slightly more than the 14% in December 2024.
This decline of confidence in Trump’s inflation policies has been especially pronounced among Republicans and independents. In December 2024, 76% of Republicans expected him to reduce inflation, but in this poll just 44% of Republicans still think so. Independents were not nearly so optimistic at the end of 2024, when 28% thought Trump would lower inflation; only 9% think so now. Democrats never much believed he would cut inflation. Just 8% said that in the month after he was reelected and 4% now.
Which party is better on issues
Among nine issues, the Republicans are seen as considerably better able to handle three issues than Democrats and slightly better on two issues. Democrats are seen as slightly better on two issues and substantially better on two issues. Republicans have substantial advantages on crime, immigration and border security, and national defense, and a have a slight advantage on the federal deficit and taxes. Democrats have slight advantages on the economy and on inflation, and have large advantages on the topic of Medicare and Social Security and on health care. These issue strengths have been common images of the parties for some time.
However, since January, the Republican advantage on taxes has declined from 9 points to 2 points. The slight GOP edge on the economy has flipped from a 3-point advantage to a 3-point Democratic advantage, and the Democratic lead on inflation has increased from 1 point in January to 7 points in May.
At the same time, substantial percentages, generally involving about a third or more of all people, say the parties are about the same when it comes to handling major issues or that neither would be good, a sign of disenchantment with both parties. The full results are shown in Table 7.
Table 7: Which party is better, across issues
Among adults
| Issue | Net Rep minus Dem | Republican party | Democratic party | Both about the same | Neither would be good |
| Crime | 22 | 41 | 19 | 28 | 12 |
| Immigration and border security | 19 | 46 | 27 | 15 | 13 |
| National defense | 15 | 42 | 27 | 20 | 11 |
| The size of the federal deficit | 4 | 27 | 23 | 26 | 24 |
| Taxes | 2 | 33 | 31 | 19 | 17 |
| The economy | -3 | 32 | 35 | 19 | 14 |
| Inflation and the cost of living | -7 | 28 | 35 | 20 | 16 |
| Medicare and Social Security | -16 | 27 | 43 | 17 | 13 |
| Health care | -20 | 24 | 44 | 16 | 15 |
| Marquette Law School Poll, national survey, May 20-26, 2026 | |||||
| Question: Do you think the (Republican party) or the (Democratic party) would do a better job handling each of the following issues? | |||||
Opinion of the parties and vote for Congress in November
Both political parties are seen negatively, with the Republican party in Congress faring better than the Democrats. Thirty-seven percent approve of how Republicans in Congress are doing their job, while 30% approve of the job congressional Democrats are doing theirs.
Democrats are less positive about the job Democrats in Congress are doing than are Republicans about the congressional GOP. Among Democrats, 52% approve of Democrats in Congress, while among Republicans, 74% approve of their party in Congress. This asymmetry between partisans accounts in part for the lower rating of Democrats in Congress. Both partisan camps very strongly disapprove of the other party: 92% of Democrats disapprove of Republican job performance in Congress and 91% of Republicans disapprove of the job performance of congressional Democrats.
The Republican and Democratic parties are more nearly equal in favorability in May than a year ago. In the current poll, 38% have a favorable opinion of the Republican party, and 36% are favorable to the Democratic party. A year ago, in May 2025, 41% were favorable to the Republican party and 32% to the Democratic party. Republicans are more positive to their party, 80%, than Democrats are to their party, 69%. This gap has narrowed since May 2025, when 88% of Republicans were favorable to the GOP and 64% of Democrats had a favorable view of their party.
Looking ahead to the November congressional elections, among registered voters, 46% say they would vote for the Democratic candidate and 45% would vote for the Republican, with 7% saying they would vote for neither and 1% who say they would not vote. The slight Democratic advantage is also seen among likely voters, i.e., those who say they are certain they will vote, with 49% saying they would vote for a Democratic candidate and 48% for a Republican candidate.
The congressional vote has tightened substantially from April when, among registered voters, 48% backed Democratic candidates and 44% supported Republicans, and there was a large Democratic advantage among likely voters, 53% for Democrats and 43% for Republicans.
Some of this shift is due to an increase in likelihood of voting among Republicans and a decline among Democrats. In April, 56% of Republicans said they were certain to vote in November, which rose to 59% in May. Among Democrats, those certain to vote declined from 67% in April to 58% in May.
The percentage of partisans who expect to vote for a candidate of their own party in the fall elections shifted only slightly from April to May, though independents became more supportive of each party, as shown in Table 8.
Table 8: 2026 congressional vote by party identification
Among registered voters
| Poll dates | Congressional vote choice | |||
| Democratic candidate | Republican candidate | Neither | Would not vote | |
| Republican | ||||
| 5/20-26/26 | 3 | 92 | 4 | 1 |
| 4/8-16/26 | 5 | 92 | 2 | 1 |
| 1/21-28/26 | 6 | 92 | 2 | 0 |
| 11/5-12/25 | 4 | 91 | 5 | 0 |
| Independent | ||||
| 5/20-26/26 | 33 | 21 | 38 | 9 |
| 4/8-16/26 | 24 | 15 | 52 | 9 |
| 1/21-28/26 | 36 | 10 | 51 | 4 |
| 11/5-12/25 | 38 | 17 | 39 | 6 |
| Democrat | ||||
| 5/20-26/26 | 94 | 4 | 2 | 0 |
| 4/8-16/26 | 96 | 2 | 1 | 0 |
| 1/21-28/26 | 95 | 1 | 3 | 1 |
| 11/5-12/25 | 96 | 2 | 1 | 1 |
| Marquette Law School Poll, national surveys, latest: May 20-26, 2026 | ||||
| Question: If the election for Congress were held today, would you vote for the (Democratic) candidate in your district or the (Republican) candidate in your district? | ||||
Favorability of Democratic and Republican political figures
Sen. Bernie Sanders has the highest net favorability among six prominent Democrats, followed by Rep. Alexandria Ocasio-Cortez, Rep. Hakeem Jeffries, Gov. Gavin Newsom, former Vice President Kamala Harris, and Sen. Chuck Schumer. All have net negative favorability, with the exception of Sanders, whose net favorability is zero. Jeffries is the least well known. Harris is the best known of the Democrats, followed by Sanders, Ocasio-Cortez, Newsom, and Schumer and then by Jeffries. The ratings are shown in Table 9.
Table 9: Favorability of Democratic political figures
Among adults
| Political figure | Favorability | |||
| Net favorability | Favorable | Unfavorable | Haven’t heard enough | |
| Bernie Sanders | 0 | 45 | 45 | 10 |
| Alexandria Ocasio-Cortez | -12 | 31 | 43 | 26 |
| Hakeem Jeffries | -16 | 22 | 38 | 41 |
| Gavin Newsom | -17 | 28 | 45 | 27 |
| Kamala Harris | -21 | 37 | 58 | 5 |
| Chuck Schumer | -31 | 19 | 50 | 31 |
| Marquette Law School Poll, national surveys, latest: May 20-26, 2026 | ||||
| Question: Do you have a favorable or an unfavorable opinion of the following people or haven’t you heard enough yet to have an opinion? | ||||
The favorability of these Democrats is much higher among Democratic partisans. All have positive net favorability, with Sanders and Ocasio-Cortez remaining the top two and with Harris moving up to third-most favorable. The congressional leaders, Jeffries and Schumer, rank the lowest, though both also remain the least well known, even among Democrats. These results are shown in Table 10.
Table 10: Favorability of Democratic political figures, among Democrats
Among Democrats
| Political figure | Favorability | |||
| Net favorability | Favorable | Unfavorable | Haven’t heard enough | |
| Bernie Sanders | 66 | 80 | 14 | 7 |
| Alexandria Ocasio-Cortez | 45 | 60 | 15 | 24 |
| Kamala Harris | 40 | 69 | 29 | 2 |
| Gavin Newsom | 35 | 54 | 19 | 26 |
| Hakeem Jeffries | 24 | 42 | 18 | 40 |
| Chuck Schumer | 3 | 35 | 32 | 32 |
| Marquette Law School Poll, national surveys, latest: May 20-26, 2026 | ||||
| Question: Do you have a favorable or an unfavorable opinion of the following people or haven’t you heard enough yet to have an opinion? | ||||
Among all adults, favorability of Republican figures also finds each holding a net negative favorability rating; Secretary of State Marco Rubio has the least negative rating, followed by Vice President JD Vance and Secretary of Defense Pete Hegseth, with Trump having the most negative favorability rating, as shown in Table 11.
Table 11: Favorability of Republican political figures
Among adults
| Political figure | Favorability | |||
| Net favorability | Favorable | Unfavorable | Haven’t heard enough | |
| Marco Rubio | -11 | 34 | 45 | 21 |
| JD Vance | -15 | 39 | 54 | 8 |
| Pete Hegseth | -19 | 27 | 46 | 27 |
| Donald Trump | -25 | 37 | 62 | 1 |
| Marquette Law School Poll, national surveys, latest: May 20-26, 2026 | ||||
| Question: Do you have a favorable or an unfavorable opinion of the following people or haven’t you heard enough yet to have an opinion? | ||||
Among Republicans, each of these figures has a net positive favorability rating, with Vance the most positively viewed, followed by Trump and Rubio. Hegseth is viewed the least positively, as shown in Table 12.
Table 12: Favorability of Republican political figures, among Republicans
Among Republicans
| Political figure | Favorability | |||
| Net favorability | Favorable | Unfavorable | Haven’t heard enough | |
| JD Vance | 59 | 77 | 18 | 5 |
| Donald Trump | 53 | 76 | 23 | 0 |
| Marco Rubio | 50 | 66 | 16 | 18 |
| Pete Hegseth | 36 | 55 | 19 | 26 |
| Marquette Law School Poll, national surveys, latest: May 20-26, 2026 | ||||
| Question: Do you have a favorable or an unfavorable opinion of the following people or haven’t you heard enough yet to have an opinion? | ||||
Favorability of Pope Leo XIV
Pope Leo XIV is seen favorably by 47% and unfavorably by 19%, with 35% saying they haven’t heard enough.
The Pope is seen most favorably by Roman Catholics, 66%, and has net positive ratings among all religious affiliations. He is also best known among Catholics. Favorability by religious affiliation is shown in Table 13.
Table 13: Favorability of Pope Leo XIV, by religious affiliation
Among adults
| Religious affiliation | Net favorability | Favorable | Unfavorable | Haven’t heard enough |
| Born-again Protestant | 8 | 36 | 28 | 36 |
| Mainline Protestant | 40 | 50 | 10 | 40 |
| Roman Catholic | 50 | 66 | 16 | 18 |
| No religion | 30 | 46 | 16 | 37 |
| Other religion | 19 | 39 | 20 | 41 |
| Marquette Law School Poll, national surveys, latest: May 20-26, 2026 | ||||
| Question: Do you have a favorable or an unfavorable opinion of Pope Leo the XIV, or haven’t you heard enough yet to have an opinion? | ||||
News attention
The war with Iran was the most closely followed news event in this poll, with 72% saying they read or heard a lot about the war. That is down from 76% in April.
A gunman’s attempt to enter the White House Correspondents’ Dinner was the second-most followed story, with 54% hearing a lot.
Attention drops off for other events this past month, with Trump’s trip to China (38%) being closely followed by states redrawing congressional districts (37%). Still less attention was given to the defeat of Republican incumbents in primaries who were opposed by Trump-endorsed challengers. The least attention was given to news that the federal debt now exceeds the gross national product. The full results are shown in Table 14.
Table 14: Attention to events in the news
Among adults
| Item | Heard or read | ||
| A lot | A little | Nothing at all | |
| The U.S. war with Iran | 72 | 22 | 6 |
| A gunman who attempted to enter the White House Correspondents’ Dinner in Washington, D.C. | 54 | 34 | 12 |
| Donald Trump’s trip to China and meetings with Xi Jinping | 38 | 42 | 20 |
| States including Texas, California, and Florida redrawing their congressional districts for the 2026 elections | 37 | 34 | 29 |
| Republican incumbents who Trump opposed were defeated in Republican primaries in Indiana, Louisiana and Kentucky by candidates Trump endorsed | 29 | 34 | 37 |
| The U.S. federal debt is now greater than the nation’s total gross domestic product per year | 28 | 42 | 30 |
| Marquette Law School Poll, national survey: May 20-26, 2026 | |||
| Question: Here are some recent topics in the news. How much have you heard or read about each of these? | |||
Political violence
In the aftermath of a gunman’s attempt to enter the White House Correspondents’ dinner, 29% say the threat of violence against political leaders is a very big problem, and 40% say it is a moderately big problem. In September 2025, following the fatal shooting of Charlie Kirk, 38% said the threat of violence was a very big problem and 38% said it was a moderately big problem.
Eighteen percent say that it can sometimes be justified for Americans today to resort to violence in order to achieve political goals, while 82% say violence is never justified. In September, 11% said violence can sometimes be justified.
White House ballroom, data centers, and ACA tax credits
- 38% say tearing down the East Wing of the White House to build a ballroom is an appropriate modernization, while 61% say the East Wing should have been preserved. In November, 41% said it was an appropriate modernization.
About the Marquette Law School Poll
The survey was conducted May 20-26, 2026, interviewing 1,001 adults nationwide, with a margin of error of +/-3.4 percentage points. For registered voters, the sample size is 857, with a margin of error of +/-3.6. For likely voters, the sample size is 576 with a margin of error of +/-4.4 percentage points. For Republicans, the sample size is 413, with a margin of error of +/-5.3, and for Democrats, the sample size is 435, with a margin of error of +/-5.2. The sample of independents is 152, with a margin of error of +/-8.8. Interviews were conducted using the SSRS Opinion Panel, a national probability sample with interviews conducted online. Certain other data from this survey (focusing on those about public views of the Supreme Court) are held for release on June 4. The detailed methodology statement, survey instrument, topline results, and crosstabs for this release are available on the Marquette Law School website.