Participant characterization
In total, 627 participants (394 women/233 men) were included in this study (Table 1 and Supplementary Table S2 in the Electronic Supplementary Material). The median age was 52.0 (43.0, 62.5) years, and men were significantly older than women (padjust < 0.001). Women had a significantly higher BMI than men (padjust = 0.006). Participants had a median HGS of 28.8 (23.1, 39.0) kg, while women had a lower maximum HGS than men (padjust < 0.001), and the median sports activity was 165.0 (30.0, 311.25) minutes per week.
Clinical characteristics and functional strength
Phenotypic, metabolic and inflammatory marker
BMI differed significantly between women and men in the overall group comparison (Fig. 1A). Participants of both sexes with lower functional strength tended to have a higher BMI. HOMA-IR differed significantly in the overall comparison between sexes (Fig. 1B), and higher HOMA-IR levels were associated with the functional strength groups. CRP levels differed significantly between the groups (padjust = 0.0074) in women but not in men (Fig. 1C). CRP levels were significantly higher in the LH group than in the HH group (p < 0.05) (Fig. 1C). Interleukin- 6 (IL 6) levels differed significantly between the groups (padjust = 0.00047) in women. When compared to HH, the median IL-6 levels were significantly higher in LH (p < 0.05) and LL (p < 0.05) (Fig. 1D). Of the nine different bile acids, only deoxycholic acid (DC) was nominally significantly different across the groups (p < 0.05), with the lowest levels of deoxycholic acid in the LH and HH groups.
Metabolic and inflammatory markers across the functional strength groups (n = 627). Differences between women and men for functional strength groups in (A) Body Mass Index (BMI), (B) Homeostatic Model Assessment of Insulin Resistance (HOMA-IR), (C) C-reactive protein (CRP), and (D) Interleukin-6 (IL-6). P-values were calculated using the Kruskal-Wallis rank sum test for overall comparison with FDR correction for multiple testing and Wilcoxon test with FDR correction for multiple testing for comparison with the reference group HH (significance cut-off points: *p ≤ 0.05, **p ≤ 0.01, *** p ≤ 0.001, ****p ≤ 0.0001). HH, high sports activity and high handgrip strength; HM, high sports activity and medium handgrip strength; HL, high sports activity and low handgrip strength; LH, low sports activity and high handgrip strength; LM, low sports activity and medium handgrip strength; LL, low sports activity and low handgrip strength.
Health status, healthy lifestyle and functional strength
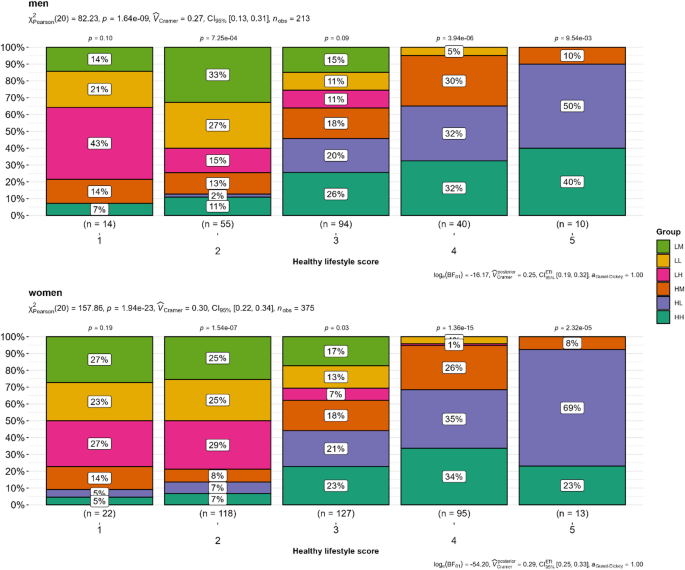
A total of 470 (75%) participants reported regular medication use, and group comparisons showed a significant difference (padjust = 0.005). The prevalence of hypertension was significantly different between the groups (padjust < 0.001). Overall, 50% of the participants had a history of hypertension and 18% (111/627) had a history of diabetes (Supplementary Table S3 in the Electronic Supplementary Material). 20% of the participants (124/627) were current smokers. Daytime sleep duration was significantly different among the groups (padjust < 0.001). The total activity was not significantly different between the groups (padjust = 0.42; see Supplementary Table S4 in the Electronic Supplementary Material). The healthy lifestyle scores of the different groups were analyzed and are shown in Fig. 2. The overall HLS was compared between women and men using Pearson’s chi-square test. HLS was compared between the groups using the same test. Overall, the prevalence of HLS scores differed significantly between the functional strength groups in both sexes (p < 0.05), and participants with higher activity levels showed higher adherence to a higher HLS (scores 4 and 5), independent of their HGS (Fig. 2).
Comparison of healthy lifestyle scores (HLS) between functional strength groups in women and men (n = 588). A higher HLS score indicates better adherence to a healthy lifestyle. The HLS scores calculated in this study ranged from 1 (low adherence) to 5 (high adherence). P-values were calculated using Pearson’s chi-squared test for overall score and group comparison, and within a single score and group comparison. HH, high sports activity and high handgrip strength; HM, high sports activity and medium handgrip strength; HL, high sports activity and low handgrip strength; LH, low sports activity and high handgrip strength; LM, low sports activity and medium handgrip strength; LL, low sports activity and low handgrip strength.
Adapted dietary inflammatory index, tryptophan intake and functional strength
Supplementary Table S4 (in the Electronic Supplementary Material) shows that the ADII was significantly different between the groups in women (p = 0.0038) but not in men. In women, there was a tendency to have a more proinflammatory ADII in the lower functional strength groups. The relative amount of tryptophan did not differ between the groups for either sex.
Gut microbiota and functional strength
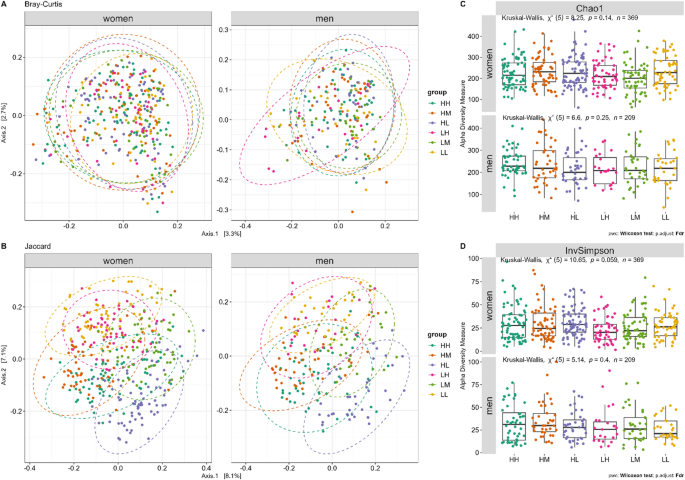
Distance plots by Bray‒Curtis and Jaccard are presented in Fig. 3A and B, with significant group differences for the unadjusted model (Bray‒Curtis, p = 0.039 (men); Jaccard, p = 0.035 (men)). After adjusting for confounders (age, HOMA-IR, CRP, IL-6, regular medication, night and day sleep, HLS, and sex), PERMANOVA revealed significant differences in beta diversity between groups in men for Bray-Curtis (p = 0.0489) and Jaccard’s similarity coefficient (p = 0.0379). The Chao1 and InvSimpson indices were not significantly different between the groups (Fig. 3C and D) for both sexes.
Differences in beta (ß) and alpha (α) diversity indices for functional strength groups (n = 578) in women and men. Differences are shown for (A) ß-diversity using the Bray-Curtis dissimilarity metric, (B) ß-diversity using the Jaccard similarity index, (C) α-diversity measured by the Chao1 richness estimator, and (D) α-diversity measured by the Inverse Simpson (InvSimpson) index. ß-diversity plots (A and B) illustrate community compositional differences between groups, whereas α-diversity indices (C and D) represent species richness and evenness within each group. In A and B, each point represents an individual sample, with colors denoting different functional strength groups. Ellipses indicate the 95% confidence intervals of each group. P-values were calculated using PERMANOVA (1,000 permutations and significance level set at p < 0.05) for ß-diversity and Kruskal-Wallis rank sum test for overall comparison with FDR correction for multiple testing for alpha diversity and Wilcoxon test with FDR correction for multiple testing for comparison with the reference group HH (significance cut-off points by *p ≤ 0.05, **p ≤ 0.01, ***p ≤ 0.001, ****p ≤ 0.0001). HH, high sports activity and high handgrip strength; HM, high sports activity and medium handgrip strength; HL, high sports activity and low handgrip strength; LH, low sports activity and high handgrip strength; LM, low sports activity and medium handgrip strength; LL, low sports activity and low handgrip strength.
Comparisons of CMM revealed potential sports activity- or HGS-related differences in the relative abundance at the genus level (see Supplementary Fig. S1 in the Electronic Supplementary Material). Akkermansia and Odoribacter were reduced in the low-activity group, independent of the HGS tertiles, and differed significantly from those in the other groups (p < 0.0001). The abundance of Streptococcus was reduced in the LH and LL groups. In contrast, taxa of the genus Fusicatenibacter were abundant only in the LH and LM groups but not in the higher sports activity groups and the LL group. Taxa of the Parasutterella genus were abundant only in the HH and LH groups with high HGS. Blautia abundance tended to be lower in those with lower HGS and decreased independently of activity level (p < 0.0001). Subsequently, analyses were performed for both the sports activity and HGS groups (Supplementary Figs. S2 and S3, respectively (Electronic Supplementary Material). Clostridium XIVa, Parasutterella, and Dialister in men were only associated with HGS and showed reduced abundance with reduced HGS (see Supplementary Fig. S2 in the Electronic Supplementary Material). Alistipes abundance was reduced only in women with lower activity levels, whereas Odoribacter and Streptococcus abundance was reduced in both sexes with lower activity levels. In contrast, the abundance of Blautia increased at lower activity levels in both sexes (Supplementary Fig. S3 in the Electronic Supplementary Material).
Metabolomics and functional strength
Two sPLS-DA models were fitted with two components in the serum and urine samples from women and men. Neither component 1 nor component 2 clearly distinguished between the groups for either sex. This was true for both the serum and urine metabolites. Enrichment analysis using HMDBs from significantly (padjust < 0.1) different serum and urine metabolites of both components was matched to terms in the SMPDB database in MetaboAnalyst. The results are presented in Supplementary Table S5 (Electronic Supplementary Material). Only caffeine metabolism was significant in the enrichment and pathway analyses of urine metabolomics in women, even after FDR correction (Supplementary Fig. S4 in the Electronic Supplementary Material).
Predictive variables for low functional strength
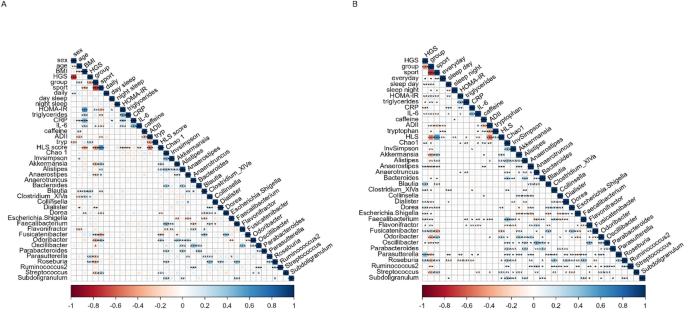
Correlation analysis was performed using the data from the previous analysis, and Fig. 4A and B show the results of the adjusted and partial correlation analyses, respectively. Correlation analysis showed that after correction for multiple testing, sports activity in minutes per week was inversely related to metabolic biomarkers and positively related to healthy lifestyle and to tryptophan intake. Sports activity was also related to Akkermansia, Alistipes, Bacteroides, Odoribacter, Oscillibacter, and Streptococcus. Absolute HGS in was more strongly related to sex, age, tryptophan intake, and the taxa Clostridium XIVa, Dialister, Escherichia.Shigella, Faecalibacterium and Parasutterella. Caffeine intake was inversely correlated with the ADII, Anaerostipes, and Flavonifractor and positively correlated with the Chao1 and InvSimpson indices. This was also true after adjusting for sex, age, and BMI.
Correlation plots showing (A) the correlations adjusted for multiple testing, and (B) the correlations adjusted for age, sex, and BMI between handgrip strength (HGS), sports activity, strength fitness groups, inflammatory and lifestyle parameters, and relative microbial abundance. Blue and red indicate positive and negative correlations, respectively. The color density and square size reflect the scale of the correlation significance cut-off points by *p ≤ 0.05, **p ≤ 0.01, ***p ≤ 0.001, and ****p ≤ 0.0001. CRP, C-reactive protein; IL-6, Interleukin 6; HLS, healthy lifestyle score; ADII, adapted dietary inflammatory index.
Supplementary Table S6 (in the Electronic Supplementary Material) presents the odds ratios (OR) with 95% confidence intervals (CI)) of the potential predictors of low functional strength using a multivariate binomial logistic regression model with functional strength groups. Significant predictors associated with an increase in the probability of low functional strength (LL) were age (OR (95% CI) 1.12 (1.08–1.17, p < 0.001)) and daytime sleep (OR (95% CI), 2.72 (1.51–5.42, p = 0.002)), whereas high HLS adherence reduced the risk of low functional strength (OR (95% CI) 0.18 (0.09–0.33, p < 0.001)). Supplementary Table S7 (in the Electronic Supplementary Material) presents the odds ratios of potential predictors, including microbiota, for the likelihood of having a low functional strength level and shows that the inclusion of the Chao1 and InvSimpson indices did not significantly change the previously mentioned confounders.


