Investors may be wondering whether HEICO stock still offers fair value at around US$331 per share, or if the recent enthusiasm has pushed it too far.
The stock has slipped about 0.5% over the past week, but is up 13.3% over 30 days, 0.6% year to date and 9.2% over the last year, with multi year returns of 102.1% over 3 years and 132.2% over 5 years.
Recent attention on HEICO has centered on its role in aerospace and defense supply chains and on investor interest in companies tied to long term air travel and defense spending themes. This context helps explain why the stock has drawn fresh capital even as some investors question whether current prices already reflect that story.
Despite this track record, HEICO currently scores just 1 out of 6 on Simply Wall St’s valuation checks. The next sections will compare different valuation methods and then finish with a broader way to think about what this stock might really be worth.
HEICO scores just 1/6 on our valuation checks. See what other red flags we found in the full valuation breakdown.
A Discounted Cash Flow model projects a company’s future cash flows and then discounts those projections back to today’s dollars, aiming to estimate what the business could be worth right now.
For HEICO, Simply Wall St uses a 2 Stage Free Cash Flow to Equity model. The latest twelve month Free Cash Flow is about $922.7 million. Analyst estimates and subsequent extrapolations suggest Free Cash Flow of $924.3 million in 2026 and $1,788.1 million in 2030, with later years extended using Simply Wall St’s own growth assumptions beyond the analyst horizon.
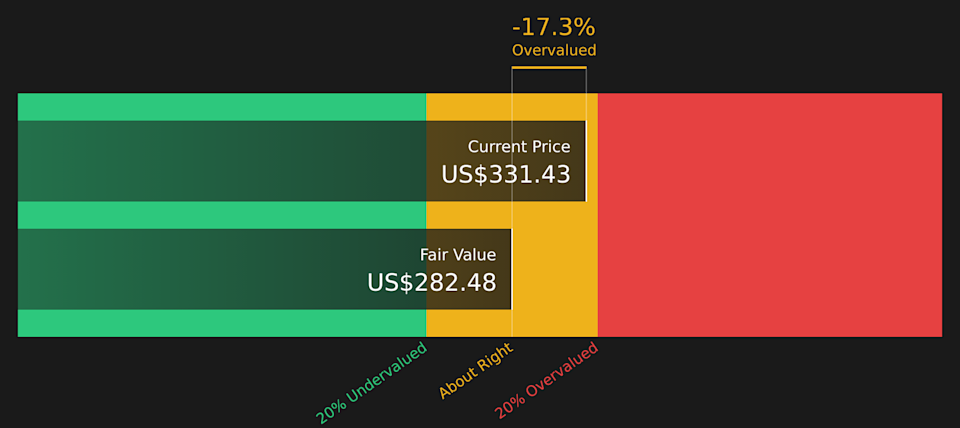
When all those future cash flows are discounted back to today using this model, the estimated intrinsic value comes out at about $282.48 per share. At a current share price around $331, the DCF output points to the stock trading at roughly a 17.3% premium to this estimate. On this particular cash flow framework, HEICO appears overvalued.
For profitable companies, the P/E ratio is a straightforward way to link what you pay for the stock to the earnings the business is currently generating. You are essentially asking how many dollars of share price you are paying for each dollar of earnings.
What counts as a “normal” or “fair” P/E depends on how quickly earnings are expected to grow and how risky those earnings appear to be. Higher growth and lower perceived risk can justify a higher multiple, while slower growth or higher risk usually points to a lower multiple.
HEICO currently trades on a P/E of 58.62x, compared with an Aerospace & Defense industry average of about 39.61x and a peer average of 78.37x. Simply Wall St’s Fair Ratio metric for HEICO is 31.96x. This Fair Ratio is a proprietary estimate of what P/E might be reasonable given factors such as the company’s earnings growth profile, profit margins, industry, market cap and risk characteristics. Because it blends all of these into one number, it can be more tailored than a simple comparison with broad industry or peer group averages.
Given that HEICO’s actual P/E of 58.62x is materially above the Fair Ratio of 31.96x, this approach points to the stock trading on a richer multiple than that framework would suggest.
Upgrade Your Decision Making: Choose your HEICO Narrative
Earlier the article mentioned that there is an even better way to understand valuation. Narratives turn that idea into a simple tool by letting you connect your view of HEICO’s story to a concrete forecast and a fair value that you can compare with the current price.
In practice, a Narrative is your version of the company’s future. It ties together assumptions about revenue, earnings and margins with a clear fair value estimate so you are not just looking at a P/E number in isolation.
On Simply Wall St’s Community page, millions of investors can access Narratives as an easy way to see how different stories translate into numbers. They can then quickly judge whether a stock looks expensive or inexpensive by lining that Fair Value up against the live market price.
For HEICO, one investor might align with a bearish Narrative that assumes earnings reach US$1.0b by 2029 and points to a fair value of about US$302.69. Another might side with a more optimistic Narrative that assumes earnings of US$1.3b by 2029 and a fair value near US$418. As new news or earnings arrive, these Narratives update automatically so your decision making stays anchored to current information rather than static, one off models.
For HEICO however we will make it really easy for you with previews of two leading HEICO Narratives:
These are not predictions, they are structured stories that tie specific assumptions to a clear fair value so you can decide which one, if either, fits your view of the stock.
Start by asking which set of assumptions feels closer to how you see HEICO’s future, then compare that fair value with the current share price around US$331.43.
Gap to current price: about 20.7% below this fair value level
Revenue growth assumption: 11.97% a year
The optimistic earnings path assumes revenue grows around 12% a year, profit margins rise toward about 19.4%, and earnings reach roughly US$1.3b by 2029.
This view leans on HEICO’s decentralized network, pricing power, and exposure to space, defense, and digital avionics, alongside ongoing bolt on acquisitions supported by a solid balance sheet.
To line up with this fair value, you would need to be comfortable with the stock trading on about a 58x P/E in 2029 and to weigh risks around longer life aircraft, sustainability rules, competition, acquisitions, and additive manufacturing carefully.
Gap to current price: about 9.5% above this fair value level
Revenue growth assumption: 7.29% a year
The more cautious path assumes revenue growth closer to 7.3% a year, margins edging up to about 17%, and earnings of roughly US$1.0b by 2029, with a lower future P/E of about 52x.
It highlights headwinds from 3D printing, customer insourcing, supply chain volatility, and acquisition risks that could restrain market share, pricing power, and returns on new deals.
Even in this scenario, HEICO is framed as a company with established positions in commercial and defense markets, but with less room for valuation to stretch further if growth or margins fall short of the higher expectations already implied in the current P/E.
Together these Narratives bracket a reasonable range for what HEICO could be worth based on different revenue, margin, and valuation outcomes, giving you a clearer reference point for your own view of the stock at today’s price.
To see how these results tie into long-term growth, risks, and valuation, check out the full range of community narratives for HEICO on Simply Wall St. Add the company to your watchlist or portfolio so you’ll be alerted when the story evolves.
This article by Simply Wall St is general in nature. We provide commentary based on historical data and analyst forecasts only using an unbiased methodology and our articles are not intended to be financial advice. It does not constitute a recommendation to buy or sell any stock, and does not take account of your objectives, or your financial situation. We aim to bring you long-term focused analysis driven by fundamental data. Note that our analysis may not factor in the latest price-sensitive company announcements or qualitative material. Simply Wall St has no position in any stocks mentioned.