Key Highlights
- Gold started a fresh decline from $5,420 and traded below $5,200.
- A major bullish trend line is forming with support at $5,040 on the 4-hour chart.
- WTI Crude Oil surged toward $120 before there was a sharp correction.
- USD/JPY extended gains and traded above 158.50.
Gold Price Technical Analysis
Gold remained well bid above $4,950 against the US Dollar. The price climbed above $5,250 and $5,350 before it started a fresh decline.
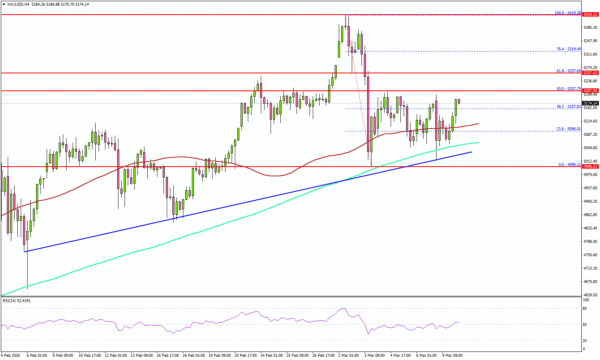
The 4-hour chart of XAU/USD indicates that the price trimmed gains from $5,419 and traded below $5,200. There was a spike below the 100 Simple Moving Average (red, 4 hours) and the 200 Simple Moving Average (green, 4 hours).
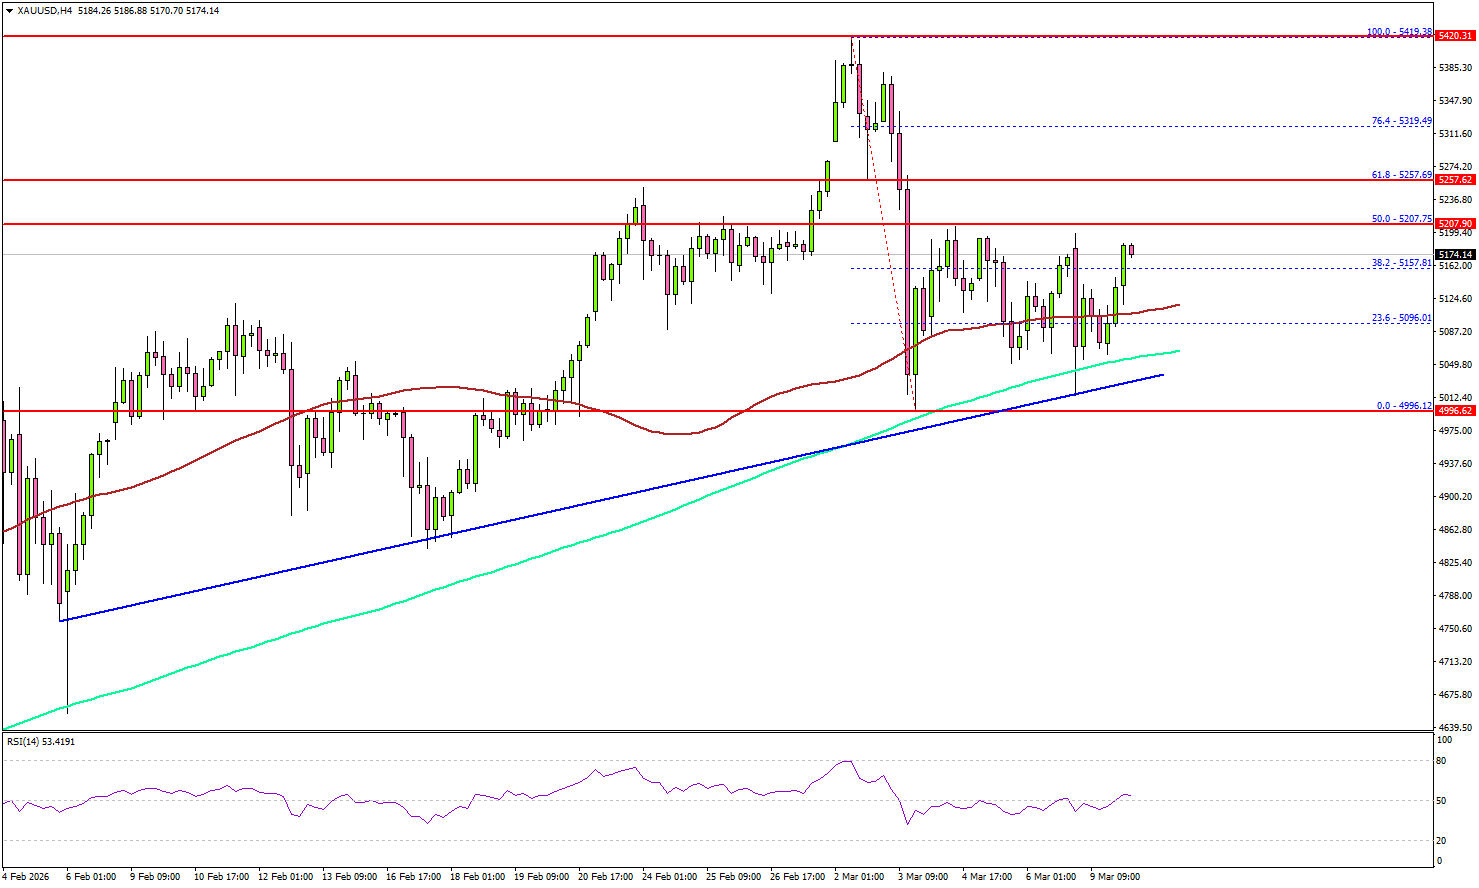
The price traded as low as $4,996 and is currently consolidating losses. There is also a major bullish trend line forming with support at $5,040.
On the upside, immediate resistance is $5,180. The next major resistance sits near $5,200. A clear move above $5,200 could open the doors for more upside. In the stated case, the bulls could aim for a move toward $5,255 and the 61.8% Fib retracement level of the downward move from the $5,419 swing high to the $4,996 low.
The main target for the bulls could be $5,320. If there is another decline, Gold might find bids near the $5,050 level. The first major support sits at $5,020, below which the price might slide to $5,000.
The main support sits at $4,950. Any more losses might call for a test of $4,880 or even $4,820 in the coming days.
Looking at WTI Crude Oil, the price rallied over 40% amid the ongoing Iran war before the bears took a stand near the $120 level.
Economic Releases to Watch Today
- US Existing Home Sales for Feb 2026 (MoM) – Forecast -2.5%, versus -8.4% previous.
- US ADP Employment Change 4-week average – Forecast 10K, versus 12.8K previous.