Gold’s selloff accelerated again as fresh headlines from the Middle East suggest the US and Iran are moving further away from a peace deal rather than closer to one. With the Strait of Hormuz still constrained and energy markets facing prolonged disruption, investors continue to focus on the inflation fallout. Persistent fears of higher-for-longer interest rates have pushed Gold toward the critical $4,000 support zone. It is now make-or-break time for the metal.
The United States launched targeted airstrikes against Iran after the downing of a US Army Apache helicopter over the Strait of Hormuz, marking a significant escalation in the conflict and further reducing the likelihood of a near-term US-Iran agreement. Yet oil prices have remained surprisingly contained, with Brent holding around the $92-$93 area rather than surging back toward $100. Oil, markets appear to be treating the situation as an extension of an existing “status quo” rather than the start of a new crisis.
What investors have not accepted is the inflation fallout. Every additional week of disruption keeps energy prices elevated and reinforces expectations that central banks will need to maintain restrictive policy settings for longer. That is the force driving Gold lower. The market focused on what the conflict means for inflation, interest rates and yields.
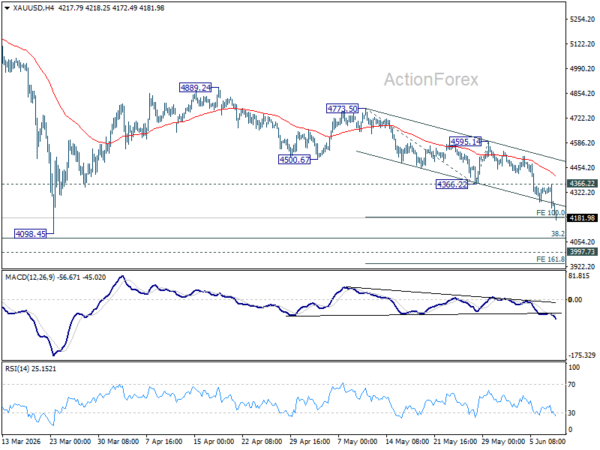
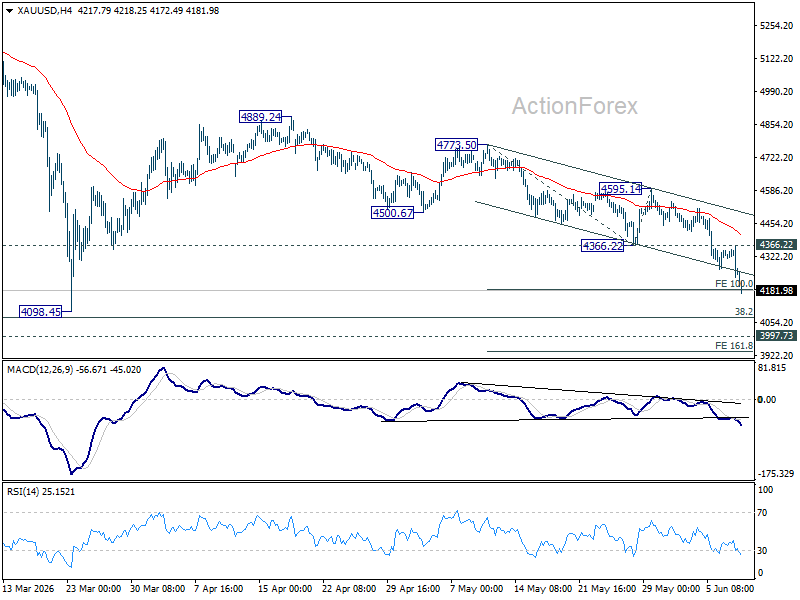
The technical damage has been substantial. Gold has already reached 100% projection of 4,773.50 to 4,366.22 from 4,595.14 at 4,187.86 on downward acceleration. With 4,366.22 now firmly acting as resistance, sellers remain in control and the next downside target stands at 161.8% projection at 3,936.16 . Momentum suggests that a test of the key $4,000 area is no longer a question of if, but when.
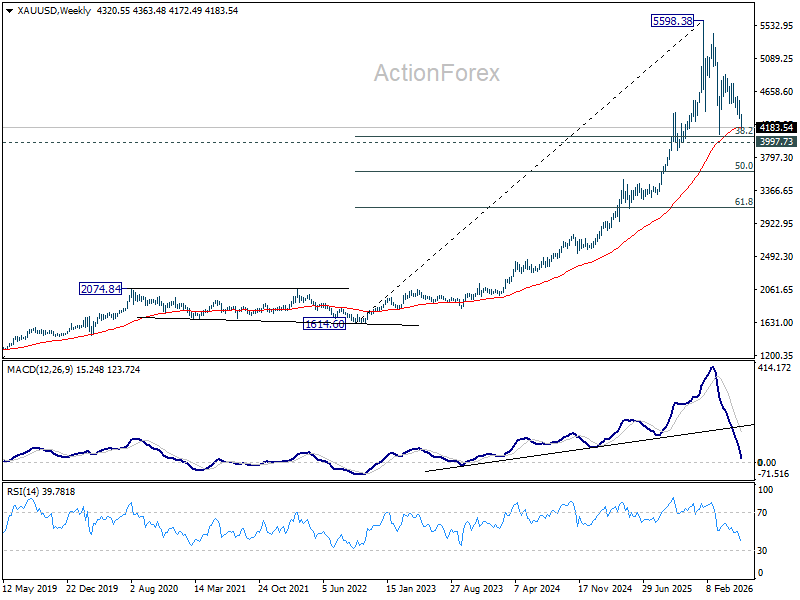
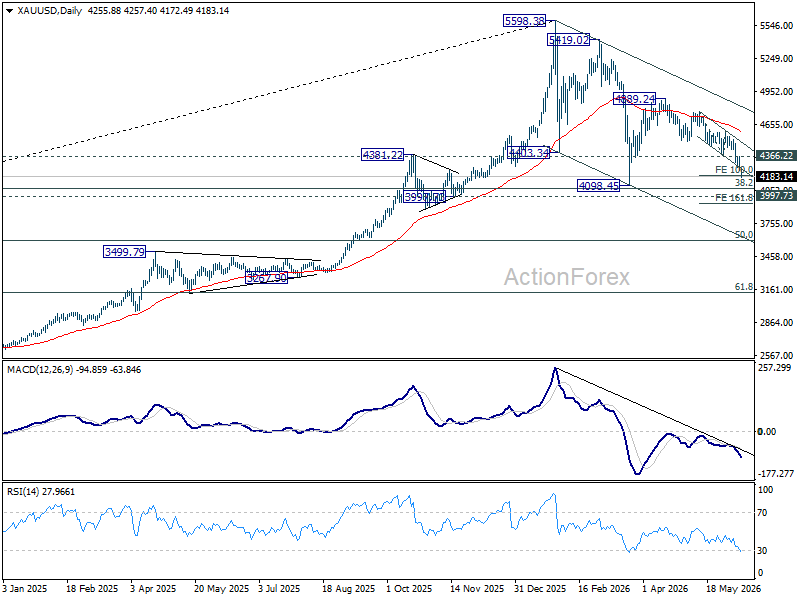
That is where the story becomes interesting. The area around $4,000 is not just another psychological level. It is one of the most heavily reinforced support zones on the chart. The March low sits at 4,098.45. There is T38.2% retracement of 1,614.60 (2022 low) to 5,598.38 at 4,076.57. Structural support comes in at 3,997.73. Together, they form a cluster that is likely to attract intense attention from both buyers and sellers.
The critical question is whether the current macro environment is strong enough to force a sustained break lower. While markets are increasingly pricing tightening from ECB and potentially Fed, the broader economy is showing signs of slowing. This is not a replay of 2022 when central banks were forced into an aggressive inflation-fighting campaign. It is a stagflationary environment where policymakers have limited room to keep raising rates before growth begins to buckle.
Unless the global economy is heading into a much more aggressive tightening cycle than currently anticipated, $4,000 should ultimately hold as the floor of this correction.
If $4,000 fails decisively, however, the narrative changes completely. The market would no longer be debating how deep the correction becomes. It would be debating whether the entire uptrend from the 2022 lows is undergoing a major reversal, with 50% retracement of 1,614.60 to 5,598.38 at 3,606.49 emerging as the next major downside objective.