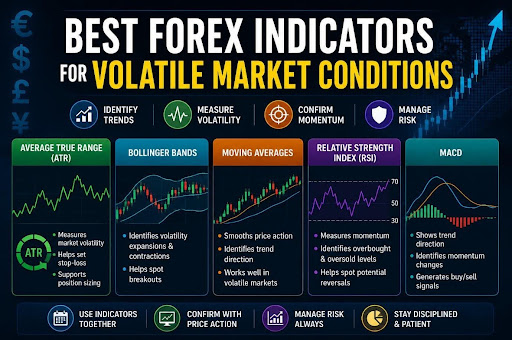

The forex market can also be highly unpredictable during major economic events, central bank announcements and geopolitical developments. These high-volatility periods tend to present opportunities and risks for traders alike. With such market conditions, many traders use indicators to understand market trends, measure momentum and manage management.
While no indicator can predict the market perfectly, the right tools can help you make informed decisions. In the following guide, we will look at some of the best forex indicators for volatile market conditions and how they can support your trading strategy.
Why Volatility Matters in Forex Trading?
Volatility indicates how quickly and how far prices move in a given time period. The market can experience during volatile conditions:
- More trading opportunities
- Increased risk levels
- Fake outs and Reversals
If you have no clear strategy, these rapid moves can lead to poor trades. Hence, many traders use forex indicators to better understand market conditions before entering a trade.
What Makes a Good Indicator in Volatile Markets?
The best forex indicators during the volatile conditions should help traders:
- Measure market volatility
- Identify trend directions
- Confirm momentum
- Support risk management
Let’s go through some of the most common indicators.
Best Forex Indicators for Volatile Market Conditions
Volatile markets can be difficult to navigate, but the right forex indicators can help traders identify opportunities and manage risk more efficiently. Here is the list of the best forex indicators:
Average True Range
The average true range is a popular indicator used to measure market volatility. Unlike trend indicators, ATR focuses on how much a currency pair moves rather than where it moves.
It helps:
- Measure levels of volatility
- Place stop-loss orders
- Supports position sizing
- Good for big news events
For example, if ATR rises ahead of a major economic release, it might suggest that larger price moves are anticipated.
Bollinger Bands
Bollinger Bands are among one of the most widely used forex indicators for identifying volatility changes and potential breakouts.
The indicator consists of:
- A moving average
- An upper band
- A lower band
When the bands widen, volatility is increasing. When they narrow, volatility is decreasing.
Moving Averages
Moving Averages help smooth price fluctuations and make trends easier to identify. They are especially useful when markets become noisy during volatile conditions.
The two most common types are:
- Simple Moving Average
- Exponential Moving Average
If price consistently remains above a moving average, it may indicate an uptrend. If it remains below, it may suggest a downtrend.
Relative Strength Index (RSI)
The relative strength Index (RSI) is a momentum indicator that measures the strength of recent price movements.
RSI values range from 0 to 100.
- Above 70: Potentially overbought
- Below 30: Potentially oversold
RSI can be particularly useful when traders want to know whether a strong move still has momentum or may be losing strength.
MACD
The Moving Average Convergence Divergence (MACD) indicator helps traders identify trend direction and momentum changes. It consists of:
- MACD Line
- Signal Line
- Histogram
When the MACD line crosses above the signal line, it may indicate bullish momentum. A cross below the signal line may suggest bearish momentum.
How to Combine Forex Indicators Effectively?
Sometimes a single indicator can generate false signals. A better approach is to combine indicators with different functions.
For instance:
- ATR for Measuring Volatility
- Moving Average for direction of trend
- RSI for confirmation of trend
This combination can provide a clearer view of market conditions and improve decision-making.
How to Read Forex Charts Alongside Indicators?
Even the best forex indicators work better when combined with chart analysis. Learning how to read forex charts can help traders understand the context behind indicator signals.
Key chart elements to watch:
- Levels of resistance and support
- Trend lines
- Types of candlesticks
- Breakout Zones
For example, if RSI shows strong momentum and price breaks above a major resistance level, the signal may be more reliable. When traders learn to read forex charts, they can utilise indicators more effectively rather than relying on them solely.
Conclusion
Uncertain market conditions can be difficult but also can provide good trading opportunities. Forex indicators like ATR, Bollinger Bands, Moving Averages, RSI and MACD are reliable tools that can help traders to better understand market activities and make more informed decisions. But indicators work best when combined with proper risk management and a good understanding of market structure. By knowing how these tools work and applying them with chart analysis, traders can approach volatile markets with more confidence.
Post from ENGR NEWS WIRE