Hendrik Bessembinder has spent years asking one of the most important and counterintuitive questions in investing: if the stock market creates enormous wealth in aggregate, why do most individual stocks fail? In his March 2026 study “One Hundred Years in the U.S. Stock Markets,” Bessembinder extended his 2018 research, “Do Stocks Outperform Treasury Bills?” to cover a full century of U.S. market history—every common stock listed between January 1926 and December 2025.
The study encompassed 29,754 stocks issued by 29,081 firms, drawing on the Center for Research in Security Prices database. The picture that emerges is humbling.
A Century of Every U.S. Stock Ever Listed
Bessembinder measured outcomes two ways. The first is the buy-and-hold return— what a dollar invested at a stock’s first listing date grew to by the time it was either delisted or the study ended, with dividends reinvested. The second is shareholder wealth creation, which asks how much richer shareholders became in dollar terms compared to parking their money in Treasury bills. SWC accounts for dividends, share repurchases, and new share issuances—reflecting what shareholders in aggregate actually experienced. He found that the average stock was only in the database for 11.7 years, and the annualized value-weighted market return was 10.1%.
Key Findings
1. The Market Won Big, Most Stocks Didn’t, but a Few Won Spectacularly.
While the mean buy-and-hold stock return over the century was 30,621%, the median return was negative 6.9%. And only 48% generated any positive return at all, and only 41% managed to outperform despite their much greater risk.
Fewer than 28% of stocks outperformed the market index over their lifetimes. In other words, most stocks are not just underperforming—they are losing. The stock market’s extraordinary aggregate wealth creation was driven by a small number of enormous winners operating within a sea of disappointments.
The outcome is a result of stock returns being positively skewed—a stock can lose at most 100% but can gain thousands of percent. Thus, the distribution is lopsided with a few extreme winners pulling the average far above the typical experience.
2. Wealth Creation was Shockingly Concentrated: $91 Trillion—Created by Just 3.7% of Companies
Of the 29,081 firms in the study, roughly 59% destroyed shareholder wealth relative to Treasury bills. The other 41% created positive wealth—but only the top 3.72% of firms (about 1,082 companies) account for all $91 trillion in net wealth creation. The rest, taken together, netted out to zero: their gains and losses cancelled each other.
The concentration is even more striking at the very top. Just two firms—Apple and Nvidia—accounted for more than 10% of all the wealth created in U.S. stock markets over the entire century. The top five firms (Apple, Nvidia, Microsoft, Alphabet, and Amazon) together represent 21% of aggregate wealth creation. The top 46 firms account for half of all $91 trillion.
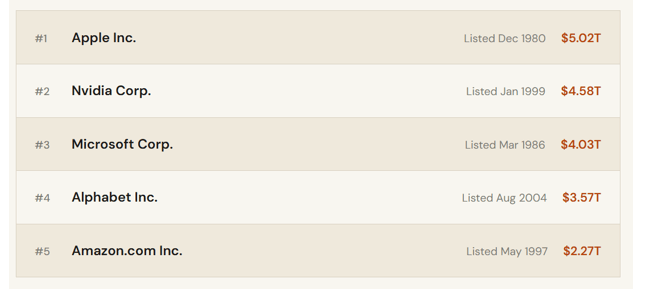
In dollar terms, Apple alone created $5.02 trillion in shareholder wealth above what Treasury bills would have produced. Nvidia created $4.58 trillion. Microsoft, $4.03 trillion. These are extraordinary sums generated by a handful of companies within a universe of nearly 30,000.
3. Wealth Concentration Is Getting Worse, Not Better
Perhaps most striking is how dramatically this concentration has accelerated in recent years. Bessembinder examined decade-by-decade results and found that in the first six decades of the sample (1926–1985), the median decade-horizon return was 63.6%, and 61.2% of stocks beat Treasury bills. In the most recent four decades (1986–2025), those figures fell to 5.8% and 47.9%, respectively—despite the value-weighted market performing strongly in this period. And in his 2018 study, he found that 89 companies accounted for half of all wealth creation from 1926 to 2016. Extending the sample by just nine more years—to 2025—and that number collapsed to 46.
He also found that in the nine years from 2017 to 2025 generated $48.36 trillion in net shareholder wealth—more than the entire preceding 90 years combined. And that wealth was staggeringly concentrated: the top 30 firms in that period accounted for 61% of all gains. By comparison, the top 30 firms through 2016 accounted for only 31% of gains. Nvidia alone captured 9.3% of all post-2016 wealth creation. The following table shows the five leading wealth creators.
4. Time and Compounding: The Great Equalizers
Among the stocks with the highest cumulative returns, none were short-term sensations. The top performers—Altria Group (formerly Philip Morris), which turned $1 into $4.4 million over 100 years, and Vulcan Materials, which returned $501,591 per dollar—achieved this not through explosive annual gains, but through persistently above-average returns compounded across many decades. Altria’s annualized return was 16.5%. Vulcan’s was 14%.
Among stocks requiring at least 20 years of data, the champion was Nvidia, with a 37% annualized compound return over 27 years, followed by Netflix (32.5%), Axon Enterprise (32.4%), and Amazon (31.1%). Notably, none of these high-annualized-return stocks appear on the highest cumulative-return list — a powerful illustration that extremely high returns historically do not persist over longer horizons.
Five Takeaways That Should Change How You Think About Markets
1. Diversification isn’t just prudent—it’s mathematically necessary.
The evidence implies that the standard financial planning assumption of “average” expected returns is misleading. In a skewed distribution, most individual investors holding concentrated portfolios will experience below-average returns, as the median return is lower than the mean. And if fewer than 4% of stocks account for all the market’s net gains, a concentrated stock portfolio is essentially a lottery ticket. Owning the entire market is the most reliable way to capture the few enormous winners that are nearly impossible to identify in advance.
2. The average return is not your likely return.
The mean buy-and-hold return of 30,621% sounds extraordinary—but the median investor holding a single stock experienced a loss. When return distributions are skewed, mean outcomes are misleading. Focus on the full distribution of possibilities and plan for the median, not the average.
3. Time in the market is paramount—but only if you own the right assets.
The study confirms the classic adage: the highest cumulative returns are achieved by stocks held for the longest periods. But this cuts both ways. Holding a bad stock for a long time locks in a long-term loss. The lesson isn’t just “stay invested”—it’s “stay invested broadly.”
4. Wealth concentration is increasing—and this matters for active investors.
The narrowing of wealth creation to fewer and fewer firms over the past decade makes stock picking harder, not easier. If half of all market gains are now generated by 46 companies (down from 89 a decade ago), missing even a handful of those names can dramatically undercut performance. Bessembinder found that 19 of the top 30 wealth creators in the 2017–2025 period—including Nvidia, Tesla, Meta Platforms, Eli Lilly, and AMD—did not even appear on the top 30 list through 2016. Identifying these winners in advance, of course, is the challenge that has humbled active investors for generations.
5. Treasury bills are a tougher benchmark than most investors realize.
Nearly 59% of all publicly listed companies in U.S. history have failed to beat Treasury bills over their lifetimes. That’s a reminder that the risk premium in equities is real — but it is earned unevenly, and most individual stocks fail to deliver it. The premium exists at the portfolio level, not the individual stock level.
Bessembinder closed his paper with an open question that no dataset can yet answer: whether the concentration of stock market gains will continue to narrow as artificial intelligence reshapes competitive dynamics. The past century suggests that wealth has always flowed to a tiny fraction of firms — but the past decade has seen that fraction shrink to its smallest yet. Whatever the next century holds, the lesson from the last one is clear: the market rewards patience, breadth, and the humility to accept that no one reliably picks the winners in advance.