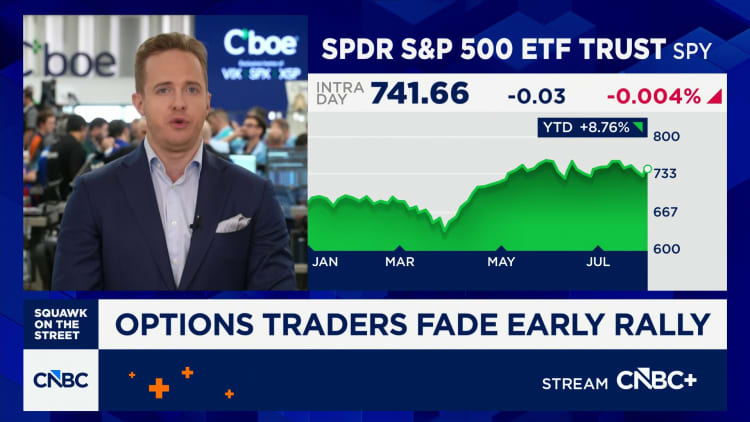
After a whipsaw two days of price action, bulls and bears are facing off again at a key technical level in the S&P 500. At the same time, an increasingly popular volatility-based measure of market breadth leans bearish.
Options traders and market makers in Chicago were quick to buy dips below 7,500 in the benchmark index Friday, but almost as quick to sell rallies above that level. Slipping too far below could open the door for more sharp moves like the one on Wednesday that sent the S&P 500 to the lowest since mid-June, positioning data tracked by SpotGamma and Barchart suggest.
Combined open interest of both puts and calls is highest at 750 on the SPY ETF, according to Barchart. A few points lower, at 745, is where both Barchart and SpotGamma data suggest market makers no longer act as a source of stability. That’s where dealer hedging activity flips “negative gamma,” meaning the dip-buying and rip-selling that’s kept the S&P 500 coming back to 7,500 could start to erode.
“If SPX breaks below 7,450 we will look for a bigger downside move,” SpotGamma founder Brent Kochuba wrote in a note to clients Friday. Kochuba added that selling short-dated calls around the 7,520 strike on SPX looked appealing.

SPX in 2026
Another major factor contributing to the S&P 500’s seesaw action for months around the same level is the stark division within the stock market’s constituents. The polarization between AI tech stocks and underperforming sectors led one measure of market unison – Cboe’s 1-month implied correlation index – to reach an all-time lows earlier this month, a sign to some the market was getting fragile.
But index has since surged, going from a reading of 3.3 on July 10 to 12 this week, indicating a broader-based rally and firmer overall market. Case in point, when the S&P 500 fell on Wednesday following the fed meeting, only one stock in the index registered a 52-week low.
The index, which measures the expected correlation between the top 50 stocks in the S&P 500 over the next month, touched 3.3 on July 10. After Wednesday’s sell-off and Thursday’s broad rally, the measure rose to over 12.
That suggests the market is getting more balanced, though in previous selloffs in April and June, correlations went much higher before the market bottomed. The measure reached 20 in June, and 45 in April.