It’s been a rocky few weeks for the AI trade.
US stocks have swung wildly amid uncertainty around the Iran war and an ongoing rotation within the AI trade that’s pummeled high-flying chip stocks and hastened a rotation into other areas of the market.
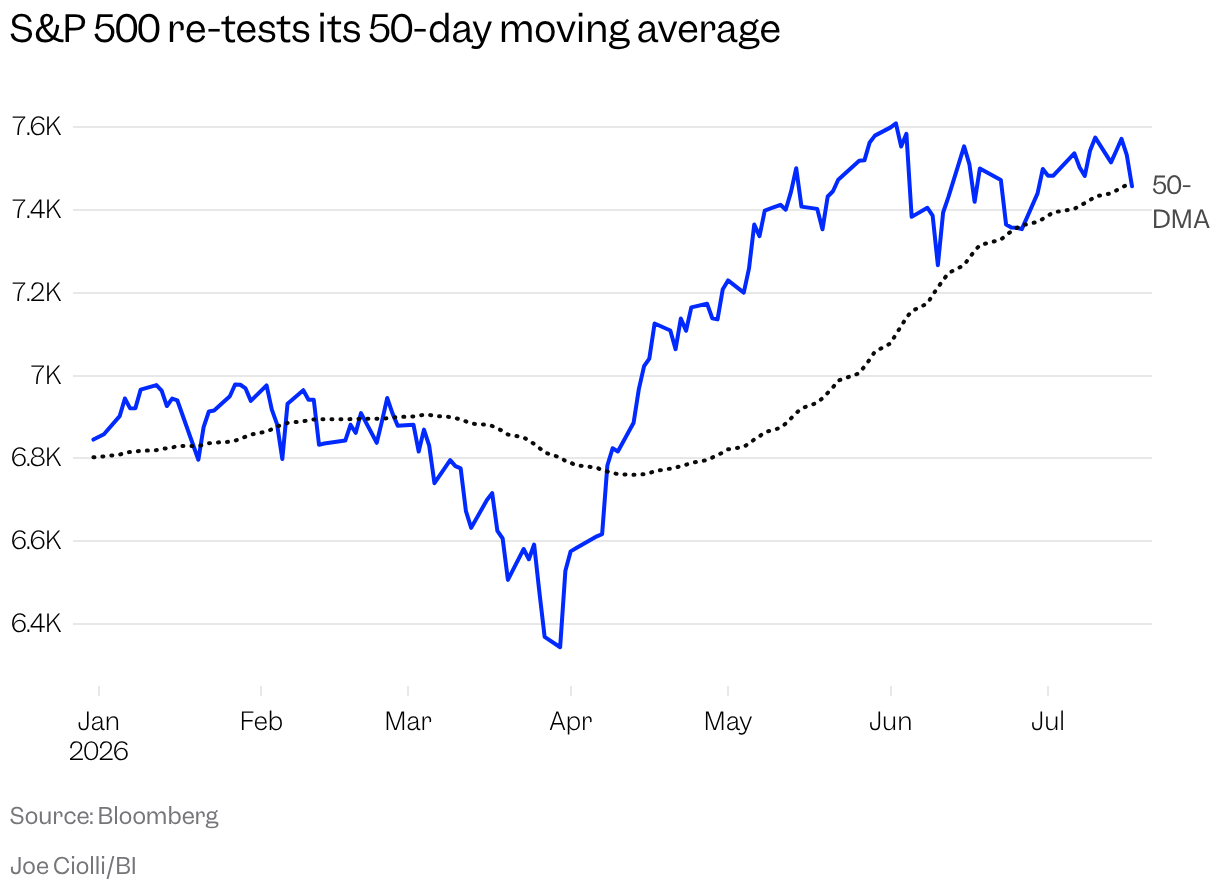
Investors have been eyeing some worrying technical signals that have flashed in markets recently. The S&P 500, for instance, recently slipped below its 50-day moving average, a key support level that some pros say signals more downside may be on the way. The index remains within less than 1% of its 50-day MA.
The Nasdaq 100, which recently broke back above its 50-day moving average, is also trading less than 1% away from its 50-day MA.
Most of the carnage is evident in the chips sector, which flirting with a technical bear market after a blistering rally in the first half of the year. The iShares Semiconductor ETF, one fund tracking the market’s largest chipmakers, is down 18% from its peak in late June.
Here’s what technical analysts say could be coming next, according to the current signals.
S&P 500 is finding technical support
Mega-cap stocks could be on track to resume their rally after a brief breakdown in momentum. Though the S&P 500 last week slipped below 7,530 — a key technical support level— dip-buyers caused the S&P 500 to climb back above the 7,500 mark, a sign that the long-term uptrend is still intact, Adam Kobeissi, a longtime analyst and the author of The Kobeissi Letter, wrote on Monday.
The benchmark index’s daily Relative Strength Index — a momentum indicator that suggests when the price of an asset is picking up steam — also recently bounced back above a level of 50, which has historically been a bullish sign for stocks.
The index’s upper and lower Bollinger Bands, which are technical levels that suggest when an asset is overbought or oversold, are currently 7,345 and 7,615, which suggest “the broader uptrend remains intact,” Kobeissi wrote.
“This week, we look for a recovery back toward 7600 as earnings season gains momentum and risk appetite stands strong. Therefore, we remain bullish of the S&P 500 with a 7700 target and 7200 stop-loss,” he added.
Long-term uptrends are intact
The S&P 500 and Dow Jones Industrial Average remain in technical ranges that suggest the longer-term move higher is still intact, Mark Newton, the head of technical strategy at Fundstrat, wrote on Friday.
Newton also pointed to the Dow Jones Transportation Average, a transportation and logistics index that’s frequently seen as a leading economic indicator, which recently closed near its all-time high.
“It’s difficult to view this past week as anything more than a rotation,” he wrote of the sell-off in chips.
Newton added that he’s eyeing 7,421 as a “make-or-break” level in the S&P 500. Should the index stay above that threshold, it could suggest a bullish environment overall for stocks.
“Until these levels are violated along with a breakdown in the equal-weighted S&P 500’s trend, I’m still inclined to view Technology’s decline as something the broader market can absorb,” he added.
Eyeing short-term bounce, with more selling possible
Stocks look primed for a small rebound after last week’s sell-off, but there’s also a chance that the chip and AI sector continue to record losses, Piper Sandler wrote in a client note on Monday.
A team of analysts led by Craig Johnson noted that the VanEck Semiconductor ETF is trading 18% below its 50-day moving average, which also marks the fund’s lowest level in eight weeks.
Analysts said they were eyeing the possibility that the ETF breaches its 200-day moving average, which would imply another 20% decline in the chips sector.
“The Semi/AI trade is facing a reality check as recent technical damage opens the door to a deeper correction toward their 200-day MAs. While short-term tactical bounce is likely, the intermediate-term trends have been violated,” the firm wrote.
Unusual volatility patterns in tech stocks
Bespoke Investment Group pointed to a notable pattern in the Nasdaq 100, which has seen more volatility lately even as it’s traded in a fairly tight range.
Over the last 50 days, the tech-heavy index has seen more than 20 trading sessions where it moved swung at least 1% in either direction. But the index overall has traded in a range where its highest level has been less than 10% away from its lowest level.
In instances dating back to 1971, the index has posted a negative median return over the next six months after flashing this pattern. The index has also historically seen a “slightly weaker” performance than average for the next 12 months, Paul Hickey, the cofounder of Bespoke, wrote in a client note.
“Based on the results, it doesn’t portend an especially attractive short-term picture for the market,” Hickey said.