Bearish view
-
Sell the BTC/USD pair and set a take-profit at 58,000.
-
Add a stop-loss at 68,000.
-
Timeline: 1-2 days.
Bullish view
-
Buy the BTC/USD pair and set a take-profit at 68,000.
-
Add a stop-loss at 58,000.

Bitcoin price remained on edge, a few points above the key support of $60,000, as risky assets retreated. The BTC/USD pair was trading at 62,473, inside the range it has remained at in the past few days. This price is much lower than last month’s high of 82,890.
Bitcoin Price Retreats as Risky Assets Drop
The BTC/USD pair retreated modestly as investors dumped risky assets, including technology stocks. Top US indices like the Nasdaq 100 and S&P 500 indices retreated, with technology companies leading the plunge.
At the same time, the US Dollar Index (DXY) jumped sharply, reaching its highest level in more than a year. This rebound happened as investors reacted to the recent Federal Reserve interest rate decision in which officials hinted that they will hike interest rates later this year. Bitcoin often retreats when the Fed is hiking interest rates.
The BTC/USD pair also retreated as spot Bitcoin ETF outflows continued, a sign that demand has waned. Data shows that spot Bitcoin ETFs have shed over $2.3 billion in assets this week after losing $2.4 billion in the previous month.
A likely reason for the ongoing outflows is that investors are rotating to the stock market, which has done well in the past few years. The S&P 500 and Nasdaq 100 indices have surged to a record high this year.
The next key catalyst for the BTC/USD pair is the upcoming US PCE report, which is the most important inflation figure. Analysts expect the data to show that inflation jumped in May as energy prices jumped. The most recent consumer price index (CPI) jumped to 4.2%, raising the possibility that the Fed will hike rates.
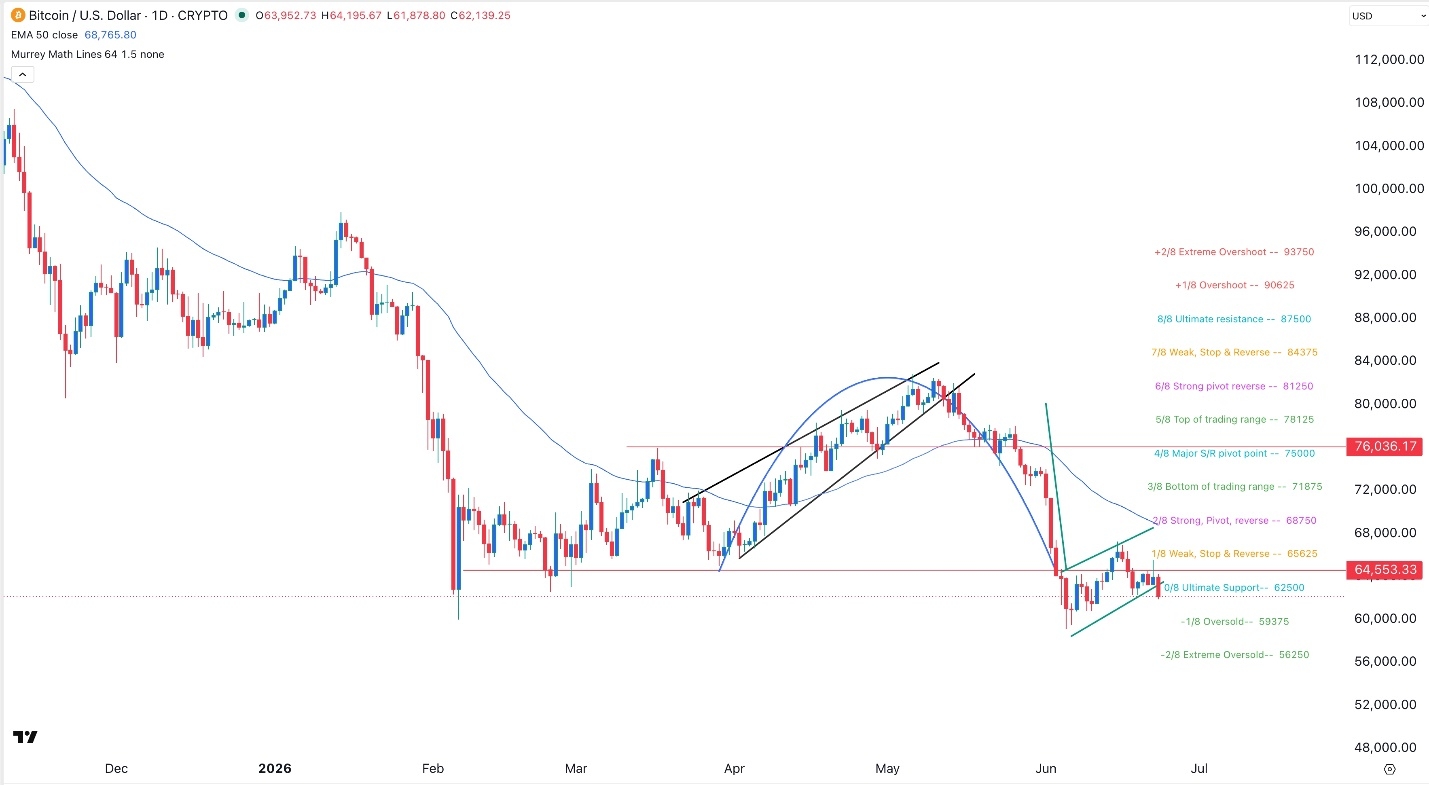
BTC/USD Technical Analysis
The daily chart shows that Bitcoin price has slumped in the past few weeks as demand has waned. It has slumped below the 50-day Exponential Moving Average (EMA).
Most notably, the BTC/USD pair has formed a large bearish flag pattern, a common continuation pattern. It has moved to the lower side of the flag section and may move below it soon.
Bitcoin has also dropped below the Ichimoku cloud indicator. Also, the Relative Strength Index (RSI) has started to drift downwards. Therefore, the pair will likely continue falling, potentially to the key support level of 58,000. This view will be confirmed if it drops below the support of 60,000.
Ready to trade our daily Forex signals? Here’s a list of some of the best crypto brokers to check out.
Crispus Nyaga is a Technical Analyst at DailyForex with more than eight years of experience as a financial analyst, coach, and trader. He specializes in technical analysis of major currency pairs and cryptocurrencies, using chart patterns, trend structure, and key indicators to frame trading scenarios for Forex and digital asset markets. Crispus has worked with well-known brokers including ATFX, easyMarkets, and OctaFX, and his market commentary has been published widely on platforms such as Seeking Alpha, InvestingCube, Capital.com, and Invezz.
As seen on: SeekingAlpha, Macrostreet.com, Invezz.com, Forbes, Investing.com, Marketwatch, Crypto.news