Today’s Gold Analysis Overview:
-
The Overall Gold Trend: Bearish.
-
Today’s Gold Support Points: $4310 – $4250 – $4160 per ounce.
-
Today’s Gold Resistance Points: $4400 – $4460 – $4530 per ounce.
Today’s Gold Trading Signals:
-
Bullish Scenario: Buy gold from the support level of $4260 with a target of $4430 and a stop-loss at $4200.
-
Bearish Scenario: Sell gold from the resistance level of $4500 with a target of $4300 and a stop-loss at $4540.

Note: These recommendations are suitable for medium-to-long-term traders, provided there is strict adherence to capital and risk management
Daily Technical Analysis of Gold/US Dollar (XAU/USD):
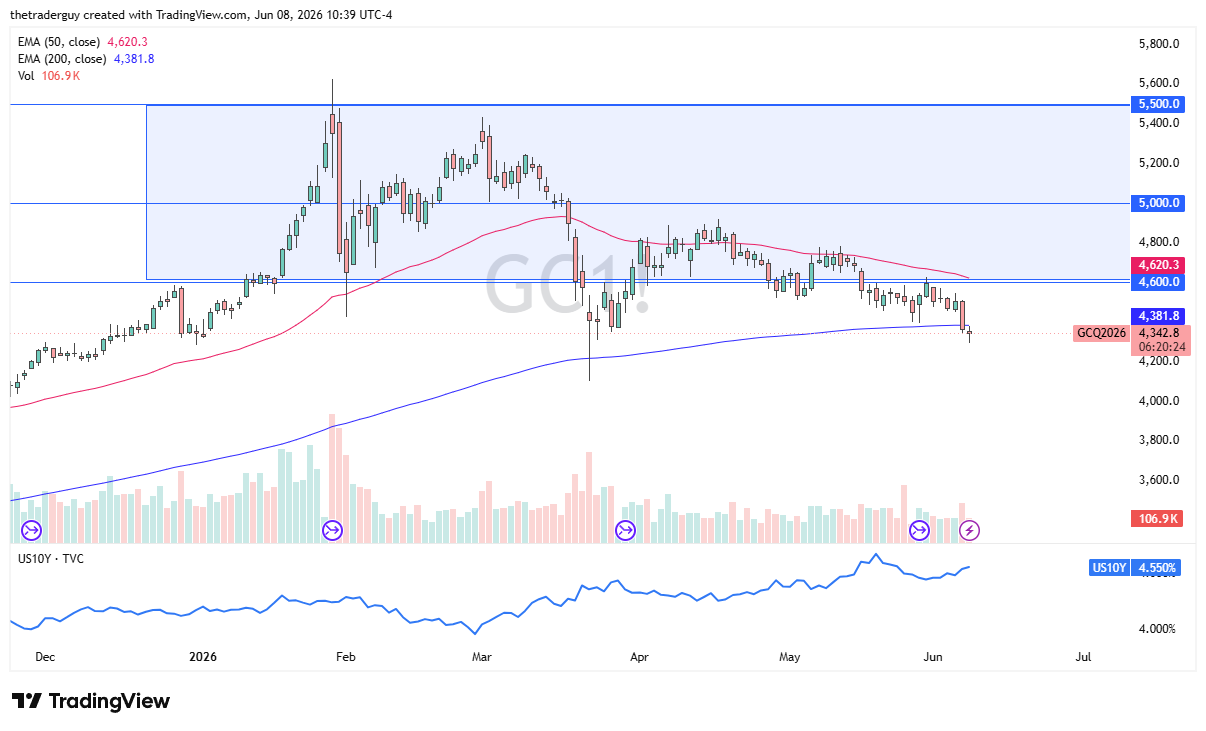
Gold prices are attempting to recover during Tuesday’s trading after a strong sell-off wave that pushed them to a two-month low near $4268 per ounce. However, the strength of the US dollar continues to limit the yellow metal’s ability to achieve sustainable gains. Across the best gold trading company platforms, the upward rebound did not exceed the $4351 per ounce level, as the US dollar remains stronger due to better-than-expected US jobs data.
From a technical perspective, the short-term outlook for gold remains bearish, based on the performance on the daily timeframe. Accordingly, the gold price breaking below the 200-day Simple Moving Average (SMA) indicates that the technical situation has deteriorated significantly following the intense sell-offs witnessed last week.
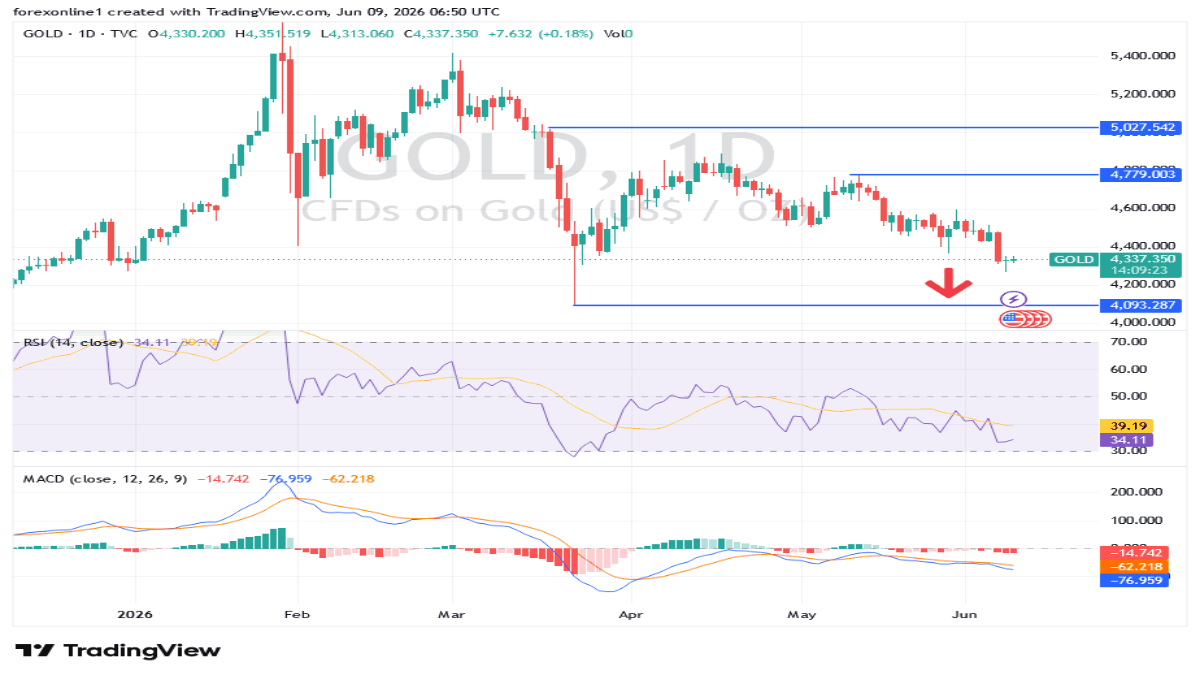
Consequently, the next major support zone is the long-term upward trendline near $4230 per ounce. With selling pressure below that, support levels become less clear down to last March’s lows around $4100, opening the way for a sharper decline if sellers maintain control.
Technically, the movement of technical indicators for the gold trend continues to confirm sellers’ dominance over the trend. The 14-day Relative Strength Index (RSI) is around a reading of 40, awaiting stronger selling pressure until reaching oversold conditions. The MACD indicator is under bearish pressure, and moving averages still point to the potential for greater losses.
Conversely, a break in the current bearish outlook could occur if prices first return to the vicinity of the resistance levels of $4520 and $4660 per ounce over the same period.
Gold Forecast Summary:
Gold prices will remain under selling pressure pending the reaction to the announcement of US inflation figures this week, alongside the trajectory of the conflict in the Middle East, which increases investor risk aversion and pushes oil prices to record levels.
Trading Tips:
Traders who adopt the prevailing trend prefer to wait for corrective rallies to seize new selling opportunities, while strictly adhering to capital management and using appropriate stop-loss orders, especially with expectations of increased volatility in the future.
Ready to trade our Gold price forecast? We’ve made a list of the best Gold trading platforms worth trading with.
Mahmoud has been working fulltime in the Foreign Exchange markets for 12 years. Offers his analysis, articles and recommendations at the most renewed Arabic websites specialized in the global financial markets, and his experience gained a lot of interest among Arab traders. Works on providing technical analysis, market news, free signals and more with follow up for at least 12 hours a day, and aims to simplify forex trading and the concept of trading for his audience.
As seen on: mahmoud.a@dailyforex.com