
Back in April, in the wake of turbulence in US stocks, I wrote about volatility at the market level. What I didn’t mention was a significant divergence across sectors.
Technology and energy have registered as the most volatile equity sectors. That’s not very surprising given that artificial intelligence and oil prices have been key drivers of stock price fluctuations this year. Technology is, by far, the largest sector of the US stock market (37.5% as of the end of May), so its broader impact is huge. Energy stocks represent just 3.2% of the market but punch above their weight from a volatility perspective.
Over the past 10 years, tech and energy have topped the volatility tables more than any other sectors. If you think about volatility as risk, that makes these sectors, and the stocks in them, tricky to navigate. But if you see volatility as creating investment opportunities, that makes the two sectors potentially very profitable.
A Tale of 2 Volatile Sectors
No two sectors of the US stock market have led the volatility rankings more often than technology and energy over the past 10 years. I looked at volatility for Morningstar’s 11 US equity sector indexes with my colleague Aditya Pillai, a quantitative researcher on Morningstar Indexes. We measured standard deviation of returns, or how much returns have varied from their averages. On a calendar-year basis, energy has been one of the two most volatile sectors in eight out of 10 years from 2016 through 2025. Technology has led in six of 10.
In some years when tech and energy have led the volatility tables, the two have moved in opposite directions from a performance perspective. That was certainly the case in early 2026. Tech stocks, especially in software-related industries, were hit by AI disruption fears, while energy benefited from higher oil prices resulting from the Iran war. It was also the case in 2022. In that year, tech stocks sank in a market pullback, while energy benefited from an oil price spike following Russia’s invasion of Ukraine.
But in other years when technology and energy led in volatility, the two sectors moved in the same direction. That applies to 2018, when both sectors suffered losses amid US-China trade tensions. It also applies to 2019 and 2021, when the two sectors gained ground, lifted by market recoveries.
Looking at long-term returns, there’s no comparison between technology and energy. Tech has been the best-performing US equity sector over the past 10 years. Energy has underperformed the broad market, though not as badly as healthcare, consumer defensives, or real estate.
As a result of its phenomenal performance, the tech sector has seen its share of the US equity market rise to 37.5% today from 17.6% 10 years ago. AI is only the latest theme behind the sector’s success. Mobile, cloud computing, and digitization accelerated by the pandemic all lifted tech stocks over the past decade. But with that success has come stretched valuations, high expectations, and inevitable skepticism. At several points in recent years, swings between “risk-on” and “risk-off” market sentiment have caused pullbacks.
Energy, by contrast, has seen its share of the US equity market shrink from 6.6% 10 years ago to 3.2% today. Oil prices are a key driver of energy sector returns, and they have been exceptionally volatile in recent years. A supply glut saw the price of oil fall to under $30 in 2016 from over $100 a barrel in 2014. Then the pandemic sent oil futures into negative territory in 2020. Both the 2022 Russian invasion of Ukraine and the 2026 Iran war pushed oil back over $100 per barrel. Competition from renewable energy sources has also weighed on the sector.
It’s also important to look at equity sector composition. According to the table of Morningstar US sector indexes below, tech and energy are among the more concentrated (though not as top-heavy in their constituent profile as communication services and consumer cyclical). Tech is the highest priced sector on a price/earnings basis, though its mega-cap orientation acts as something of a counterweight. Energy is low-priced but on the low end of the size spectrum.
Why Does It Matter That Technology Stocks and Energy Names Are Volatile?
Investors have a hard time sticking with volatile assets. We tend to get euphoric during good times and despondent in rough stretches. Extrapolating current behavior leads us to overpay for popular investments and shun underperformers that may be more attractively priced.
Yet, for valuation-driven investors, price fluctuations in tech and energy create opportunity. It’s instructive to look at sector-level valuation aggregating Morningstar Equity Research’s stock-level estimates. According to the graph below, the tech sector was overvalued in much of 2023 and 2024, but selloffs of early 2025 and 2026 created discounts.
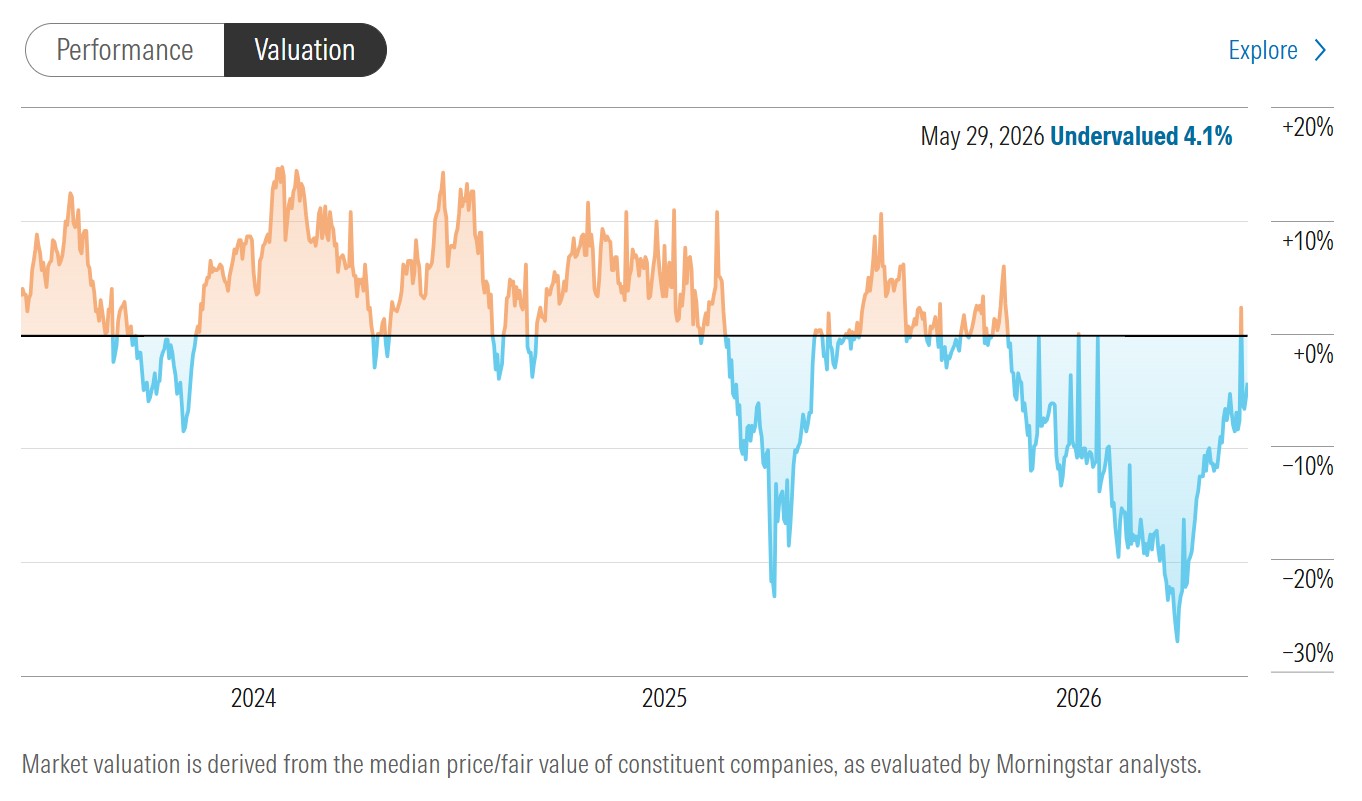
When stock prices as of the end of May were compared with analyst estimates of intrinsic value, some massive tech names, such as Nvidia NVDA and Microsoft MSFT, were seen as trading at a discount. The team believes the software selloff of early 2026 was overdone in places. Meanwhile, memory stocks like Micron MU and Seagate STX were believed to trade at premiums to intrinsic value.
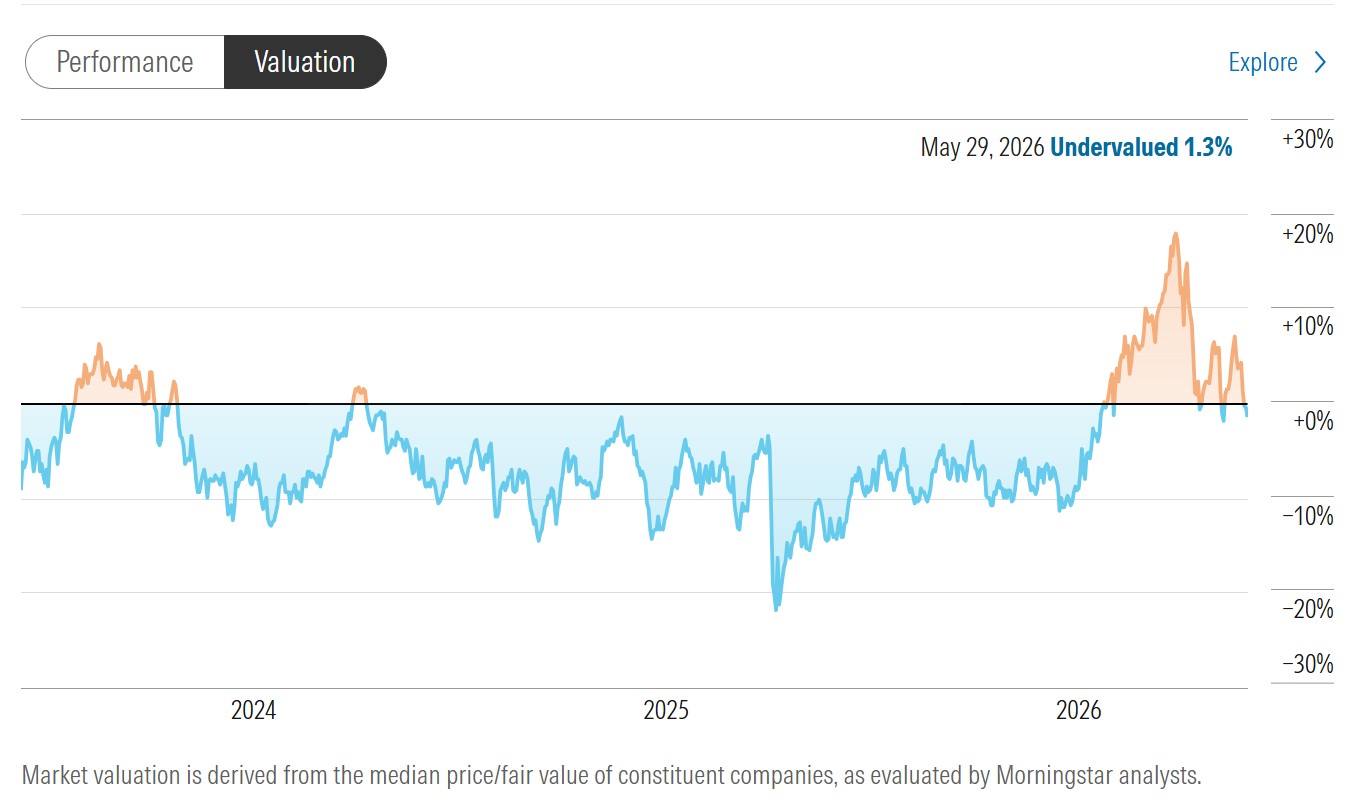
By contrast, the energy sector looked undervalued coming into 2026. After the runup of early 2026, that discount has turned into a premium. Morningstar Equity Research’s estimated midcycle oil price is $65/barrel, well below the more than $100 level driven by the Iran war. An end to Mideast hostilities and an opening of the Strait of Hormuz would likely prompt a price drop.
Will Technology and Energy Sector Volatility Persist?
Obviously, the future is unknowable, but the tech and energy sectors seem poised for continued volatility. AI, which remains the dominant investment theme of our time, is a force for both growth and disruption. As a key driver of energy sector performance, the price of oil is subject to the whims of geopolitics and ever-shifting supply/demand dynamics. While past performance isn’t predictive of future returns, volatility trends are more persistent.
In many ways, the tech and energy sectors couldn’t be more different. Yet their shared volatility has made them tricky to navigate, and their sometimes dramatic price movements present both risk and opportunity.
How are you navigating volatility in today’s stock market? Let me know at: dan.lefkovitz@morningstar.com. I read all my emails, even if I can’t reply to them all.
Correction: A previous version of this article listed two different percentages for the tech sector’s share of the US equity market as of the end of May. The correct amount was 37.5%.
Morningstar, Inc., licenses indexes to financial institutions as the tracking indexes for investable products, such as exchange-traded funds, sponsored by the financial institution. The license fee for such use is paid by the sponsoring financial institution based mainly on the total assets of the investable product. A list of ETFs that track a Morningstar index is available via the Capabilities section at indexes.morningstar.com. A list of other investable products linked to a Morningstar index is available upon request. Morningstar, Inc., does not market, sell, or make any representations regarding the advisability of investing in any investable product that tracks a Morningstar index.