
Quick overview
- XRP is currently priced at $1.87, with a market capitalization of $113.4 billion and a trading volume of nearly $1.55 billion.
- The cryptocurrency is entering a consolidation phase, indicating a balance between buyers and sellers after a recent downturn.
- A descending triangle pattern is forming, suggesting a potential sharp directional move, with key resistance at $1.95 and support at $1.85.
- If XRP breaks above $1.95 with strong volume, it could signal a recovery rather than a continuation of the downtrend.
XRP is hovering just below $1.87, up 0.9 percent over the past 24 hours, with daily trading volume a hair shy of $1.55 billion. Sitting in fifth place by market capitalisation, it’s worth a cool $113.4 billion – a figure that reflects its rather substantial circulating supply of 60.6 billion XRP out of a maximum 100 billion.
Despite the recent rollercoaster ride that most of the crypto market has been on, XRP seems to have hit the brakes. In other words, it’s entering a consolidation phase where traders are taking a moment to reassess their risk rather than running for the exits. That, at least, is the theory. The last few sessions have shown us that price action is becoming more balanced between buyers and sellers – a marked change from the sharp sell-off we saw in December.
Descending Trend Pressures Begin to Ease Up a Bit
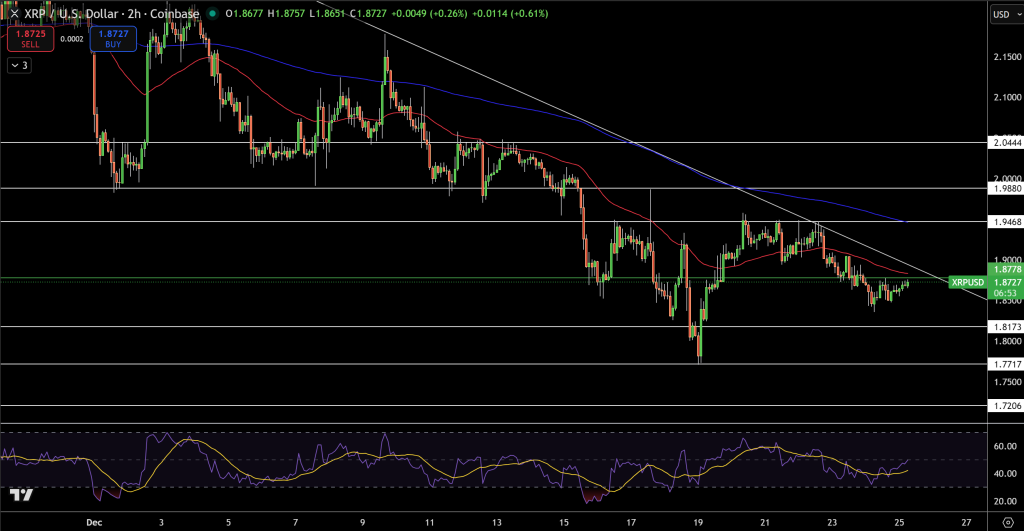
On the 2-hour chart, XRP is still being held back by a clear descending trendline that originated in early December, when prices were still recovering from a high of just over $2.15. That trendline has been largely driving the overall downturn over the past few weeks, but things are starting to change, and a more positive vibe is emerging. With smaller candles and fewer really long wicks on the downside, it’s clear that the selling pressure is beginning to fade in the vicinity of the $1.85 to $1.87 support zone.
Momentum indicators are also in line with that view. The RSI has gone from being in oversold territory, hovering around 30, up to the mid-40s – a clear sign of a shift in sentiment. What’s more, it’s created a fairly mild bullish divergence: while prices have been going down a bit, the RSI has been going up, which is a good omen.
XRP/USD Key Levels That Could Decide the Next Move
Now we have a descending triangle forming on the chart – that is, the price is being compressed between falling resistance and a bit of horizontal support. This sort of pattern often leads to a sharp directional move, either up or down. Break above $1.95, and the price could then easily hit $2.04, followed by $2.15-$2.20 – a zone where there’s a lot of prior supply.
Key downside levels to keep an eye on are:
- $1.85 as near-term support
- $1.82, followed by $1.77, if things do start to go south
As long as we keep getting higher lows on an intraday basis, the chances of a sharp fall appear to be on the wane.
XRP/USD Price Outlook: Structure Favors Recovery Over Capitulation
Now, if we do manage to break through that descending resistance with some decent volume behind it, the chart would then be telling us that we’re likely to see a bit of a recovery rather than a continuation of the downtrend. Sustain a move above $1.95, and we might see a bit of renewed upside momentum, which would certainly be in line with the improving sentiment we’re seeing across the major digital assets.
For now, though, XRP is in better shape than most of the headlines would have you believe – and is busy building a bit of a base from which its next big move will come.
Maham Arslan
Crypto News Writer | Blockchain & Web3 Reporter
Maham is a crypto news writer and market analyst specializing in breaking down the latest developments across blockchain, digital assets, and decentralized finance (DeFi). With hands-on experience covering high-impact stories—from regulatory shifts and token launches to macro-driven price movements—she delivers timely, accurate, and SEO-optimized content for fast-growing crypto media platforms.
Her expertise lies in producing daily news reports, price predictions, technical summaries, and coverage of market-moving events. Maham tracks real-time updates across global newswires, X (Twitter), and on-chain data to provide actionable insights tailored for retail traders, crypto enthusiasts, and institutional readers.
With a strong grasp of crypto fundamentals and Web3 trends, she delivers content that’s informed, accessible, and always on time.


This article is phenomenal! I’ve been struggling with this exact challenge, and your post gave me both the understanding and the tools I needed to move forward. I love how you broke down each step and explained not just what to do but why it works. The troubleshooting section was also incredibly helpful – it’s clear you understand the common pitfalls people encounter. This is going straight to the top of my reference materials!