Key Highlights
- WTI Crude Oil prices regained traction and cleared the $105 resistance.
- A key bullish trend line is forming with support at $106 on the 4-hour chart of XTI/USD.
- Gold is facing a major hurdle near $4,820.
- EUR/USD seems to be consolidating above the 1.1500 support.
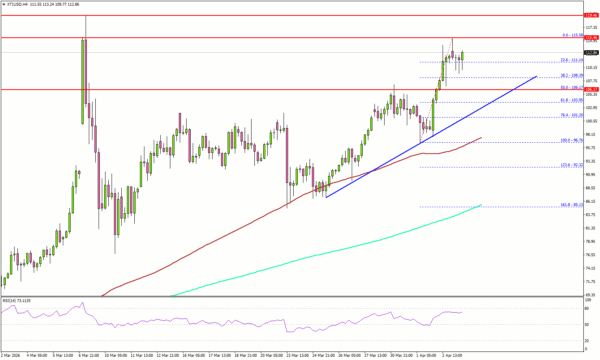
WTI Crude Oil Price Technical Analysis
WTI Crude Oil prices started a fresh increase above $98 and $100 against the US Dollar. The price cleared many hurdles near $102 to re-enter bullish zone.
Looking at the 4-hour chart of XTI/USD, the price settled well above the 100 simple moving average (red, 4-hour) and the 200 simple moving average (green, 4-hour). On the upside, immediate resistance is near the $115.50 level.
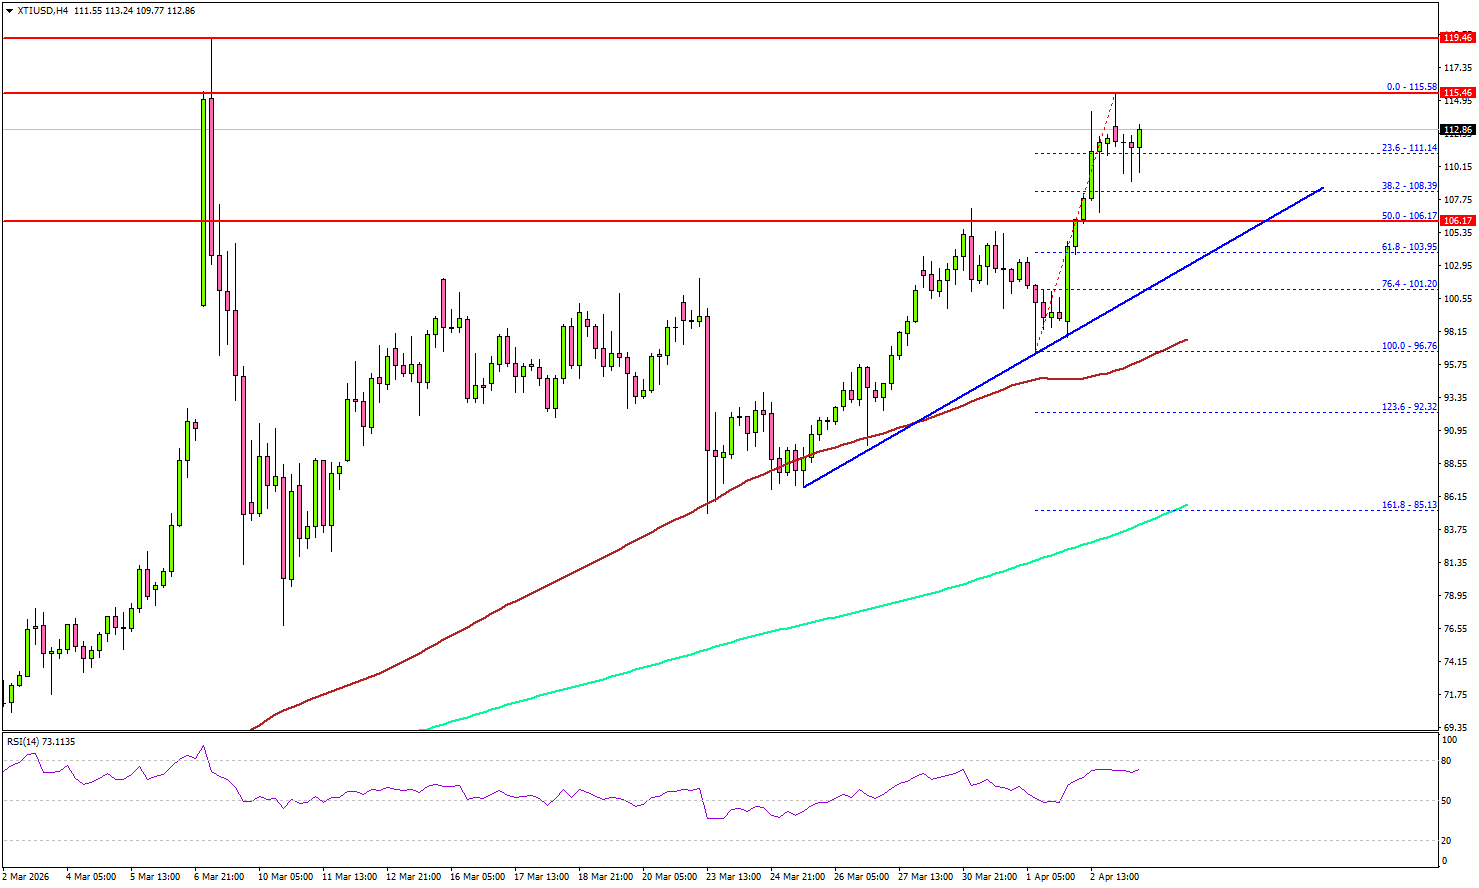
The first key hurdle for the bulls could be $118.00. A close above $118.00 might send Oil prices toward $120.00. Any more gains might call for a test of $125.00 in the near term.
On the downside, the first major support sits near the $108.20 zone. The next support could be $106.00. There is also a key bullish trend line forming with support at $106, below which the price could dive and test $102.00.
A daily close below $102.00 could open the doors for a larger decline. In the stated case, the bears might aim for a drop toward $98.00 and the 100 simple moving average (red, 4-hour).
Looking at Gold, there was a decent increase, but the bulls need to push the price above $4,820 for upside continuation.
Economic Releases to Watch Today
- Euro Zone Services PMI for March 2026 – Forecast 50.1, versus 50.1 previous.
- UK Services PMI for March 2026 – Forecast 51.2, versus 51.2 previous.
- US Durable Goods Orders for Feb 2026 – Forecast -0.5% versus 0% previous.