I wrote on the 28th December that the best trades for the week would be:
- Long of the S&P 500 Index. This gave a loss of 1.12%.
- Long of Silver with a quarter of the normal position size. This gave a loss of 2.72%.
- Long of Platinum a quarter of the normal position size. This gave a loss of 3.46%.
- Long of Gold with half the normal position size. This gave a loss of 2.32%.
- Long of Palladium with a quarter of the normal position size. This gave a loss of 4.62%.
Overall, these trades gave a large loss of 14.24% (2.85% per asset), although this was less than the previous week’s amazing gain of 22.41%.
A summary of last week’s most important data:
- US FOMC Meeting Minutes – this showed that the decision to cut rates last month was closer than expected, giving a very small hawkish tilt to future rates expectations. However, the CME FedWatch tool shows only two cuts are expected next year, as was the case at the start of last week.
- US Unemployment Claims – a slightly lower number than was expected.
Last week’s data had very little impact on the markets.
Of course, last week saw the New Year holiday and as such markets were partially closed or mostly quiet with relatively thin liquidity.
The early part of the week was dominated by a sudden collapse in the value of all the precious metals, especially the minor precious metals (Silver, Platinum, and Palladium). This bubble finally burst, with a typical minor bounce back on the Tuesday followed by a further decline on the Wednesday. New highs in the near term look unlikely. We will probably see a consolidation with gradually declining volatility.
The item which will dominate the news as we enter the new week is the American military action in Venezuela which has overthrown the Maduro regime – Maduro is now under arrest and facing potential criminal charges in New York. From the few weekend markets that exist, despite a lot of condemnation of the move, stock markets and risky assets are responding with minor positivity. This development might have the greatest effect in the WTI Crude Oil market, where prices are already low, and may now fall further. Venezuela is a major oil producer, and its oil exports were sanctioned by the USA. The new President is a supporter of the Maduro regime and it remains to be seen whether Venezuela now orients towards a more US-friendly position – in her initial comments, she says “we will not be slaves”, but what she will actually do remains to be seen.
The coming week will finally see the world fully back online with strong liquidity, as the Christmas / New Year holiday finally comes to an end in the West.
New years often start with choppy trading and confusing trend reversals, so it can be a challenging time to trade.
This week’s most important data points, in order of likely importance, are:
- US Average Hourly Earnings
- US Preliminary UoM Inflation Expectations
- US Non-Farm Employment Change
- US JOLTS Job Openings
- US Preliminary UoM Consumer Sentiment
- US ISM Services PMI
- US ISM Manufacturing PMI
- Australian CPI (inflation)
- Swiss CPI (inflation)
- US Unemployment Rate
- US Unemployment Claims
- Canada Unemployment Rate
Tuesday is a public holiday in Italy.

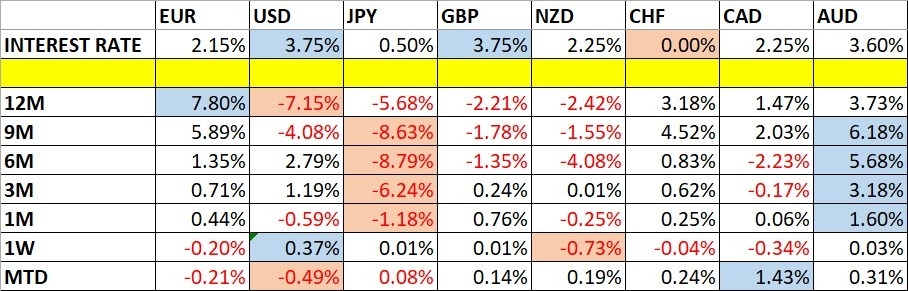
Currency Price Changes and Interest Rates
For the month of December 2025, I made no forecast.
For the month of January 2026, I forecast that the USD/JPY currency pair will rise in value.
Last week, I made no forecast, as there were no recent excessive moves in currency crosses. I again make no forecast, as low volatility persists.
The US Dollar was the strongest major currency last week, while the New Zealand Dollar was the weakest. Directional volatility fell again last week, with only 4% of all major pairs and crosses changing in value by more than 1%.
Next week’s volatility will be considerably higher.
You can trade these forecasts in a real or demo Forex brokerage account.

Key Support and Resistance Levels
Last week, the US Dollar Index printed a bullish inside bar and closed quite near the high of its range. These are moderately bullish signs. The price action is again suggesting a weak long-term bullish trend with the price above its levels of both 13 and 26 weeks ago.
The FOMC Meeting Minutes showing a lot of doubt about rate cuts may have given a very slight hawkish tilt which helped the Dollar advance last week. The big selloff in precious metals might also have helped.
I take a weakly bullish bias on the US Dollar right now. However, not much is going on here, so it will probably make sense to consider other assets on their own over the coming week.

US Dollar Index Weekly Price Chart
The USD/JPY currency pair advanced last week, the move was relatively subdued. The price has not challenged the important recent swing high lately but may be building for another challenge.
The price chart below shows a strong long-term bullish trend that has started to run out of momentum. There is no reason it cannot reactivate, which is probably mostly due to a weak Japanese Yen with a central bank that wants to hike rates but cannot do so without risking a debt crisis.
The US Dollar has been consolidating lately but is again starting to show signs of strength.
I think that if we get a significant bullish breakout with a daily close above ¥157.75 then a long trade entry will be an interesting trade.

USD/JPY Daily Price Chart
After reaching a new record high the week before last week, the price action made a textbook moderate reversal pattern, and that continued during the past week.
The selloff was partially driven by the bursting of the precious metals bubble.
Last year’s performance was stellar, at over 15%, and even with this bearish turn new highs still look likely. However, it is the start of a new calendar year and trading can be very unpredictable, so it is best to wait for a new record high daily (New York) close at 6,940 or above.
More cautious traders might prefer to wait for the big round number at 7,000 to be broken before entering a new long trade.

S&P 500 Index Daily Price Chart
Silver’s wild, meteoric rise ended dramatically last Monday, as its price and the prices of all precious metals plummeted. Gold held up best, it was the minor / industrial precious metals that saw huge drops of more than 10% in one day.
What we have seen since Monday is classic “burst bubble” price action, with railroad tracks swinging up and down with gradually decreasing volatility.
This strongly suggests that we have seen the end of the former strong trend and the beginning of a longer consolidation.
However, it is possible that the trend could resume. I will enter a new long trade if we get a daily (New York) close above $80.
Some analysts suggest this was not a bubble but a panic due to China imposing export controls on Silver for the first time. I think this is very unlikely, as there should be a plentiful available supply at current prices.

Silver Daily Price Chart
Gold saw a sharp drop last Monday, as did all other precious metals. Interestingly, although new highs for any precious metal look unlikely to happen in the near future, Gold had the smallest of all bullish bounces in precious metals after the initial drop, looking at the daily price chart below. This might be a bearish sign.
I am prepared to enter another long trade if we do get a new record high daily (New York) closing price (above $4,533.21), but I really doubt that this will happen.
The bearish swing in the S&P 500 Index also makes me more bearish on Gold, as recent years have seen a strong positive correlation between these two assets.

Gold Daily Price Chart
I see the best trades this week as:
- Long of the USD/JPY currency pair following a daily close above ¥157.75.
- Long of the S&P 500 Index following a daily close above 6,940.
- Long of Silver following a daily close above $80.
- Long of Gold following a daily close above $4,533.21.
Ready to trade our Weekly Forex forecast? Check out our list of the best Forex brokers in the world.