The current positioning in the U.S. stock market remains extremely skewed to the downside, far below the level of being overly crowded, which can be considered the most bullish signal for the market as it ensures continued momentum-driven buying. That said, Cullen Morgan, a trader at Goldman Sachs, wrote: ‘We have rebounded both quickly and sharply, and signs of chasing gains or overbought conditions have started to emerge. Going forward, a short-term pullback could be the healthiest outcome for this market, but the overall upward trend seems difficult to counteract.’
The financial blog Zerohedge pointed out that the widespread panic-driven rally in the U.S. stock market since the beginning of this month would be healthy if it occurred after a true ‘all-clear signal,’ such as Trump’s approach to tariff issues last year. However, if this panic-driven rally is solely based on the assumption that ‘Trump’s daily statements imply substantial content,’ then it is quite the opposite—it is not only unhealthy but could also represent a significant ‘bull trap.’
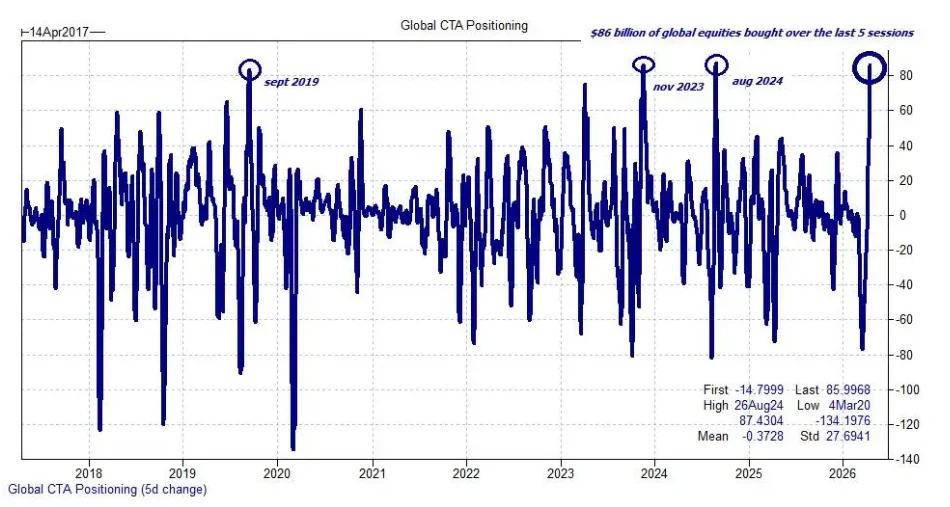
An article on Wall Street News mentioned that, from a technical analysis perspective, this was largely due to record buying by CTAs, providing support for the U.S. stock market.
 Current positions remain extremely skewed to the downside, far below overly crowded levels, which can be considered the most bullish signal for the market, as it ensures continued momentum chasing. Non-discretionary buying demand will persist, stock buybacks are set to resume, and the decline in volatility will also allow net exposure to rise again.

That said, Goldman Sachs trader Cullen Morgan wrote: ‘We have rebounded quickly and sharply, and signs of chasing gains/overbought conditions have begun to emerge.’
A series of indications reveal this:

-
The market entered overbought territory in the second shortest time ever: measured by the 14-day Relative Strength Index (RSI), the S&P 500 took only 11 days to surge from oversold territory to overbought levels by Thursday.

Deutsche Bank wrote: The speed of this rally has been breathtaking, with the index surging an astonishing 10.7% over the past 11 trading sessions. This pace slightly exceeded last year’s ‘Freedom Day’ rebound, which saw a gain of +10.1% over the same period. Excluding overlapping cases, such rapid rises are rare. Since the turn of the century, the S&P 500 has risen more than 10% within 11 trading days only 15 times, averaging about once every two years.
This rally ranks second only to the even swifter rebound seen in the summer of 1982—when Volcker drastically cut interest rates from 13%.

What happens next?
Morgan of Goldman Sachs believes that a pullback in the short term could be the healthiest outcome for this market, but the overall upward trend seems difficult to counter. He recommends substituting long positions by purchasing inexpensive call options on individual stocks or indices, which offer high cost-effectiveness. For hedging instruments, Morgan prefers downside protection through put spreads or ratio put spreads on IWM.
Meanwhile, the Nasdaq 100 Index has risen for 13 consecutive days, marking its longest winning streak since 2013, while the Nasdaq Composite’s 13-day rally is the longest since January 1992. Since 1983, such winning streaks have occurred only seven times, with subsequent forward returns proving quite substantial.

According to Goldman Sachs’ prime brokerage data, the net exposure and long-short ratio of the overall prime brokerage book remain low, standing at the 42nd and 3rd percentile of a three-year look-back period (compared to the 93rd and 14th percentile respectively at the beginning of March), while total leverage remains at the 97th percentile over the past three years. The overall short exposure in macro products (indices + ETFs) is only slightly below its peak level at the end of March.

As the earnings season for large-cap U.S. technology stocks begins, traders at Goldman Sachs have noted that hedge funds have started to repurchase shares of the MAG 7 tech giants this month, although their positions remain far below the peak levels seen in early 2016.

Systematic strategies have garnered significant attention. U.S. equities witnessed the largest five-day buying spree on record. Goldman Sachs’ latest estimate shows CTA (net) long positions at approximately $16 billion (historical highs once reached $74 billion). While there is still room for further accumulation—with Goldman Sachs estimating around $23 billion in CTA buying over the next five days—this represents a sharp decline from $70 billion earlier this week, indicating the pace will no longer be as aggressive.

We have now rebounded to the peak Gamma zone. Citing third-party data, Goldman Sachs indicates that market makers’ net Gamma position stands at approximately +$9.5 billion—although this figure appears somewhat questionable, it ranks among the highest levels in the past four years. Morgan estimates that from this point, market maker Gamma will gradually decrease during rallies but remain sticky during declines. After April options expiration, Goldman Sachs expects cleaner positioning, with Gamma strikes moving higher through systematic overwriting.

Finally, Morgan points out that the volatility market has shown notable easing: Goldman Sachs’ U.S. volatility fear index has dropped below 5/10, compared to above 9 just weeks ago, indicating implied volatility has sufficiently retreated. In many scenarios, Goldman Sachs’ derivatives team can now directly hold long volatility positions.

Editor/Liam
