Uncategorized

Stock Market Outlook: 5 Charts That Show Fresh Bull Market Is Coming

The outlook for stocks hasn’t looked this gloomy in recent memory. But one Wall Street veteran is feeling confident that the bull market isn’t over.

Jim Paulsen, current Substack writer and former chief investment strategist at The Leuthold Group, says he’s seeing a handful of signs that suggest the market was on its way to a “refreshed” bull run. That’s despite a rough start to the year for stocks, with the S&P 500 down 4% year-to-date amid concerns about AI and rising geopolitical tensions, particularly with the war in Iran.

Investors were hopeful that the conflict in the Middle East would come to an end soon. But that optimism was dashed this week when President Donald Trump vowed to blast Iran into the Stone Age during his primetime address, leading the major indexes to tank again.

“I’m not suggesting I know the stock market is done going down,” Paulsen wrote in a Substack post on Thursday. “But I am surprised and impressed by how many indicators are currently signaling bullishness! Not only simply bullishness, but a plethora of indicators are offering signals which normally only exist prior to a fresh bull market.”

“With so many indicators implying the likely start of a new bull run, I’d rather risk being in this stock market than out,” he later added.

Paulsen highlighted 16 signs that suggested that stocks were eventually headed on an upward trajectory. Detailed below are five of the most salient bullish signals he highlighted. Note that some of them are contrarian indicators.

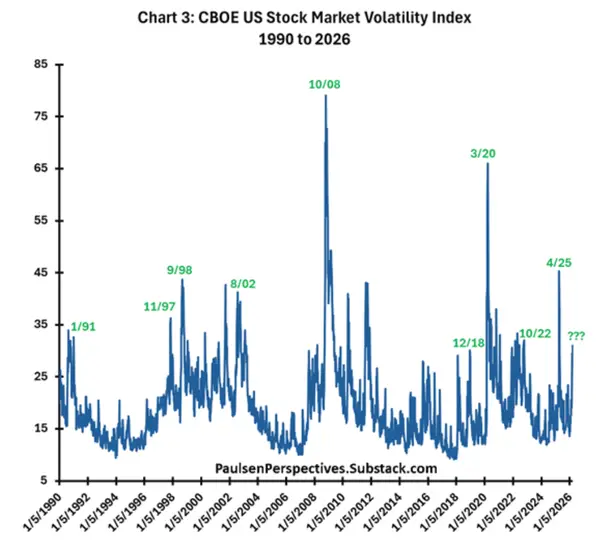
1. Stock market volatility has spiked


Jim Paulsen

The VIX, the stock market’s volatility gauge, appears to have peaked at around 31 last week. When the gauge spikes, that has historically been a good sign that stocks are nearing a bottom, Paulsen said.

When the volatility index has traded around the level 30 in the past, that has also been associated with “several historical great buying opportunities” in the market, he added.

“Sure, volatility could still rise further, but already this market signal suggests the current level of volatility is close to where several past ‘bull markets ’emerged,'” he wrote. “Today, the level of volatility argues complacency has evaporated, which is often when bulls awaken.”

2. There’s plenty of dry powder on the sidelines


Chart showing money market funds relative to disposable personal income


Jim Paulsen

The market has plenty of cash sitting on the sidelines that could potentially fuel a future bull run, Paulsen suggested. Total money market assets decreased slightly to $7.8 trillion in the last week, but remain near record highs, according to data from the Investment Company Institute.

Paulsen said that the “liquidity spike” in money market funds looked similar to the increase prior to the start of the 1992, 2002, 2009, and 2020 bull markets.

“Bulls love untapped buying power and excessive dry powder often keeps the bear quiet!” he added.

3. The stock market’s put-to-call ratio has tumbled


Chart showing the total put/call ratio of the stock market


Jim Paulsen

Investors are buying more puts — which offer downside protection if the market goes down — as opposed to calls, which benefit when the market goes up. Still, the ratio of puts to calls in the market has fallen to levels that have preceded past bull rallies, Paulsen noted.

“Today’s put/call ratio is at or below a level which marked the start great upward stock market moves during the last 20 years. Bulls love to make investor insurance (puts) worthless, and Bears often need more calls before they can bite,” he said.

4. The consumer debt-to-income ratio has collapsed


Chart showing the S&P 500 graphed against the consumer debt/income ratio


Jim Paulsen

When the ratio of consumer debt relative to income sees a sharp drop, that has historically been a bullish signal for stocks, Paulsen said, citing his analysis of the S&P 500 and the ratio over the last 60 years.

Barring the pandemic, the ratio of consumer debt-to-income is currently hovering around a 25-year low, and looks poised for a “recovery which should also fuel the stock market,” he added.

“Since 1960, when the consumer credit to income ratio begins rising, Bulls control the stock market!” he said.

5. The unemployment growth rate has spiked


Chart showing S&P 500 graphed against the 3-year growth in the US unemployment rate


Jim Paulsen

While rising unemployment is generally thought to be a negative for stocks and the economy, past multi-year unemployment spikes have actually been associated with periods of strong market growth, Paulsen said.

The 3-year growth in the US jobless rate is currently hovering near levels that preceded the stock rallies during the pandemic, following the Great Financial Crisis, and in the early 2000s, Paulsen noted.

“As demonstrated, during the post-war era, a rise in the unemployment rate by 25% during any three-year period has often proved BULLISH for the stock market!” he wrote.


Source link

Visited 1 times, 1 visit(s) today

Leave a Reply

Your email address will not be published. Required fields are marked *