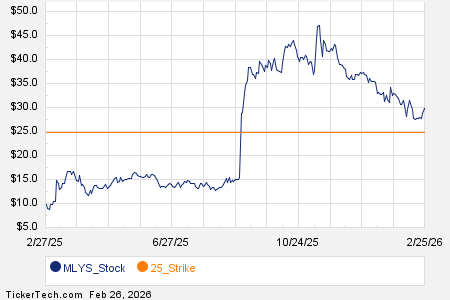
Among the underlying components of the Russell 3000 index, we saw noteworthy options trading volume today in Mineralys Therapeutics Inc (Symbol: MLYS), where a total of 137,984 contracts have traded so far, representing approximately 13.8 million underlying shares. That amounts to about 1270.3% of MLYS’s average daily trading volume over the past month of 1.1 million shares. Particularly high volume was seen for the $25 strike put option expiring March 20, 2026, with 23,014 contracts trading so far today, representing approximately 2.3 million underlying shares of MLYS. Below is a chart showing MLYS’s trailing twelve month trading history, with the $25 strike highlighted in orange:
NVIDIA Corp (Symbol: NVDA) options are showing a volume of 5.1 million contracts thus far today. That number of contracts represents approximately 509.6 million underlying shares, working out to a sizeable 285.9% of NVDA’s average daily trading volume over the past month, of 178.3 million shares.
Especially high volume was seen for the $190 strike call option expiring February 27, 2026, with 297,198 contracts trading so far today, representing approximately 29.7 million underlying shares of NVDA. Below is a chart showing NVDA’s trailing twelve month trading history, with the $190 strike highlighted in orange:

And Tesla Inc (Symbol: TSLA) options are showing a volume of 1.6 million contracts thus far today. That number of contracts represents approximately 158.8 million underlying shares, working out to a sizeable 257.7% of TSLA’s average daily trading volume over the past month, of 61.6 million shares.
Especially high volume was seen for the $410 strike call option expiring February 27, 2026, with 75,748 contracts trading so far today, representing approximately 7.6 million underlying shares of TSLA. Below is a chart showing TSLA’s trailing twelve month trading history, with the $410 strike highlighted in orange:

For the various different available expirations for MLYS options, NVDA options, or TSLA options, visit StockOptionsChannel.com.
![]() Today’s Most Active Call & Put Options of the S&P 500 »
Today’s Most Active Call & Put Options of the S&P 500 »
Also see:
NSTG Videos
Top Ten Hedge Funds Holding NVA
HCDI market cap history
The views and opinions expressed herein are the views and opinions of the author and do not necessarily reflect those of Nasdaq, Inc.