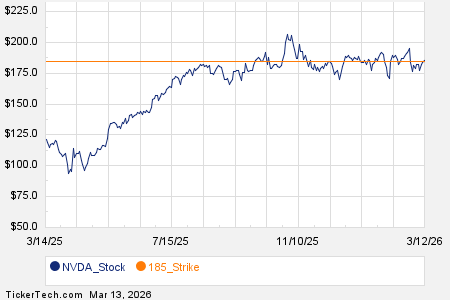
Looking at options trading activity among components of the Russell 3000 index, there is noteworthy activity today in NVIDIA Corp (Symbol: NVDA), where a total volume of 2.9 million contracts has been traded thus far today, a contract volume which is representative of approximately 287.8 million underlying shares (given that every 1 contract represents 100 underlying shares). That number works out to 149% of NVDA’s average daily trading volume over the past month, of 193.2 million shares. Particularly high volume was seen for the $185 strike call option expiring March 13, 2026, with 276,316 contracts trading so far today, representing approximately 27.6 million underlying shares of NVDA. Below is a chart showing NVDA’s trailing twelve month trading history, with the $185 strike highlighted in orange:
Eastman Kodak Co. (Symbol: KODK) saw options trading volume of 9,081 contracts, representing approximately 908,100 underlying shares or approximately 145% of KODK’s average daily trading volume over the past month, of 626,475 shares.
Especially high volume was seen for the $12.50 strike call option expiring April 17, 2026, with 3,111 contracts trading so far today, representing approximately 311,100 underlying shares of KODK. Below is a chart showing KODK’s trailing twelve month trading history, with the $12.50 strike highlighted in orange:

And Apple Inc (Symbol: AAPL) saw options trading volume of 622,314 contracts, representing approximately 62.2 million underlying shares or approximately 142.7% of AAPL’s average daily trading volume over the past month, of 43.6 million shares.
Especially high volume was seen for the $255 strike call option expiring March 13, 2026, with 61,183 contracts trading so far today, representing approximately 6.1 million underlying shares of AAPL. Below is a chart showing AAPL’s trailing twelve month trading history, with the $255 strike highlighted in orange:

For the various different available expirations for NVDA options, KODK options, or AAPL options, visit StockOptionsChannel.com.
![]() Today’s Most Active Call & Put Options of the S&P 500 »
Today’s Most Active Call & Put Options of the S&P 500 »
Also see:
TSFG Videos
YINN Average Annual Return
TURB Historical Stock Prices
The views and opinions expressed herein are the views and opinions of the author and do not necessarily reflect those of Nasdaq, Inc.