📉The stock market fell last week, with the S&P 500 shedding 1.6% to end at 6,632.19. The index is now down 5.0% from its Jan. 27 closing high of 6,978.60 and down 3.1% year-to-date. For more on the stock market, read: 2026 could be crappy for the stock market, and that would be normal 📉
–
I got mixed feedback from subscribers after I sent this brief note last Sunday night.
Some appreciated the stats that reminded them that volatility is always to be expected. Others noted that the recent pullback was far from nerve-racking and that the note was unnecessary.
I often say that I’m a long-term optimist, but a short-term cautious optimist. This is because while I’m bullish about being invested in the stock market, I’m well aware that the economy often goes into recession and stocks often go into extended downturns. This is just part of the deal.
And believe it or not, I consider myself a relatively anxious person. When the VIX jumps and stock prices drop, my first thought is always, “How much lower could prices go, and should I take some risk off?” I’ve been this way for as long as I can remember.
But with experience and education, I’ve come to understand that it’s okay to have emotional reactions — just don’t start trading on them.
The best defense against making a mistake with your investments is education. This means understanding that long-term investing comes with frequent single-digit pullbacks, many 10%+ corrections, and occasional 20%+ bear markets. Furthermore, it means understanding that it’s difficult to trade these moves in a way that’s more profitable than just buying and holding.
Indeed, managing expectations is a critical aspect of managing your money. It’s why I say that you should always keep your stock market seat belts fastened.
So, what does all of this mean in today’s context?
Well, we can’t rule out the possibility that we’ve seen the worst of the geopolitical and oil-related stock market pullback.
But we also have to accept that it could get much worse.
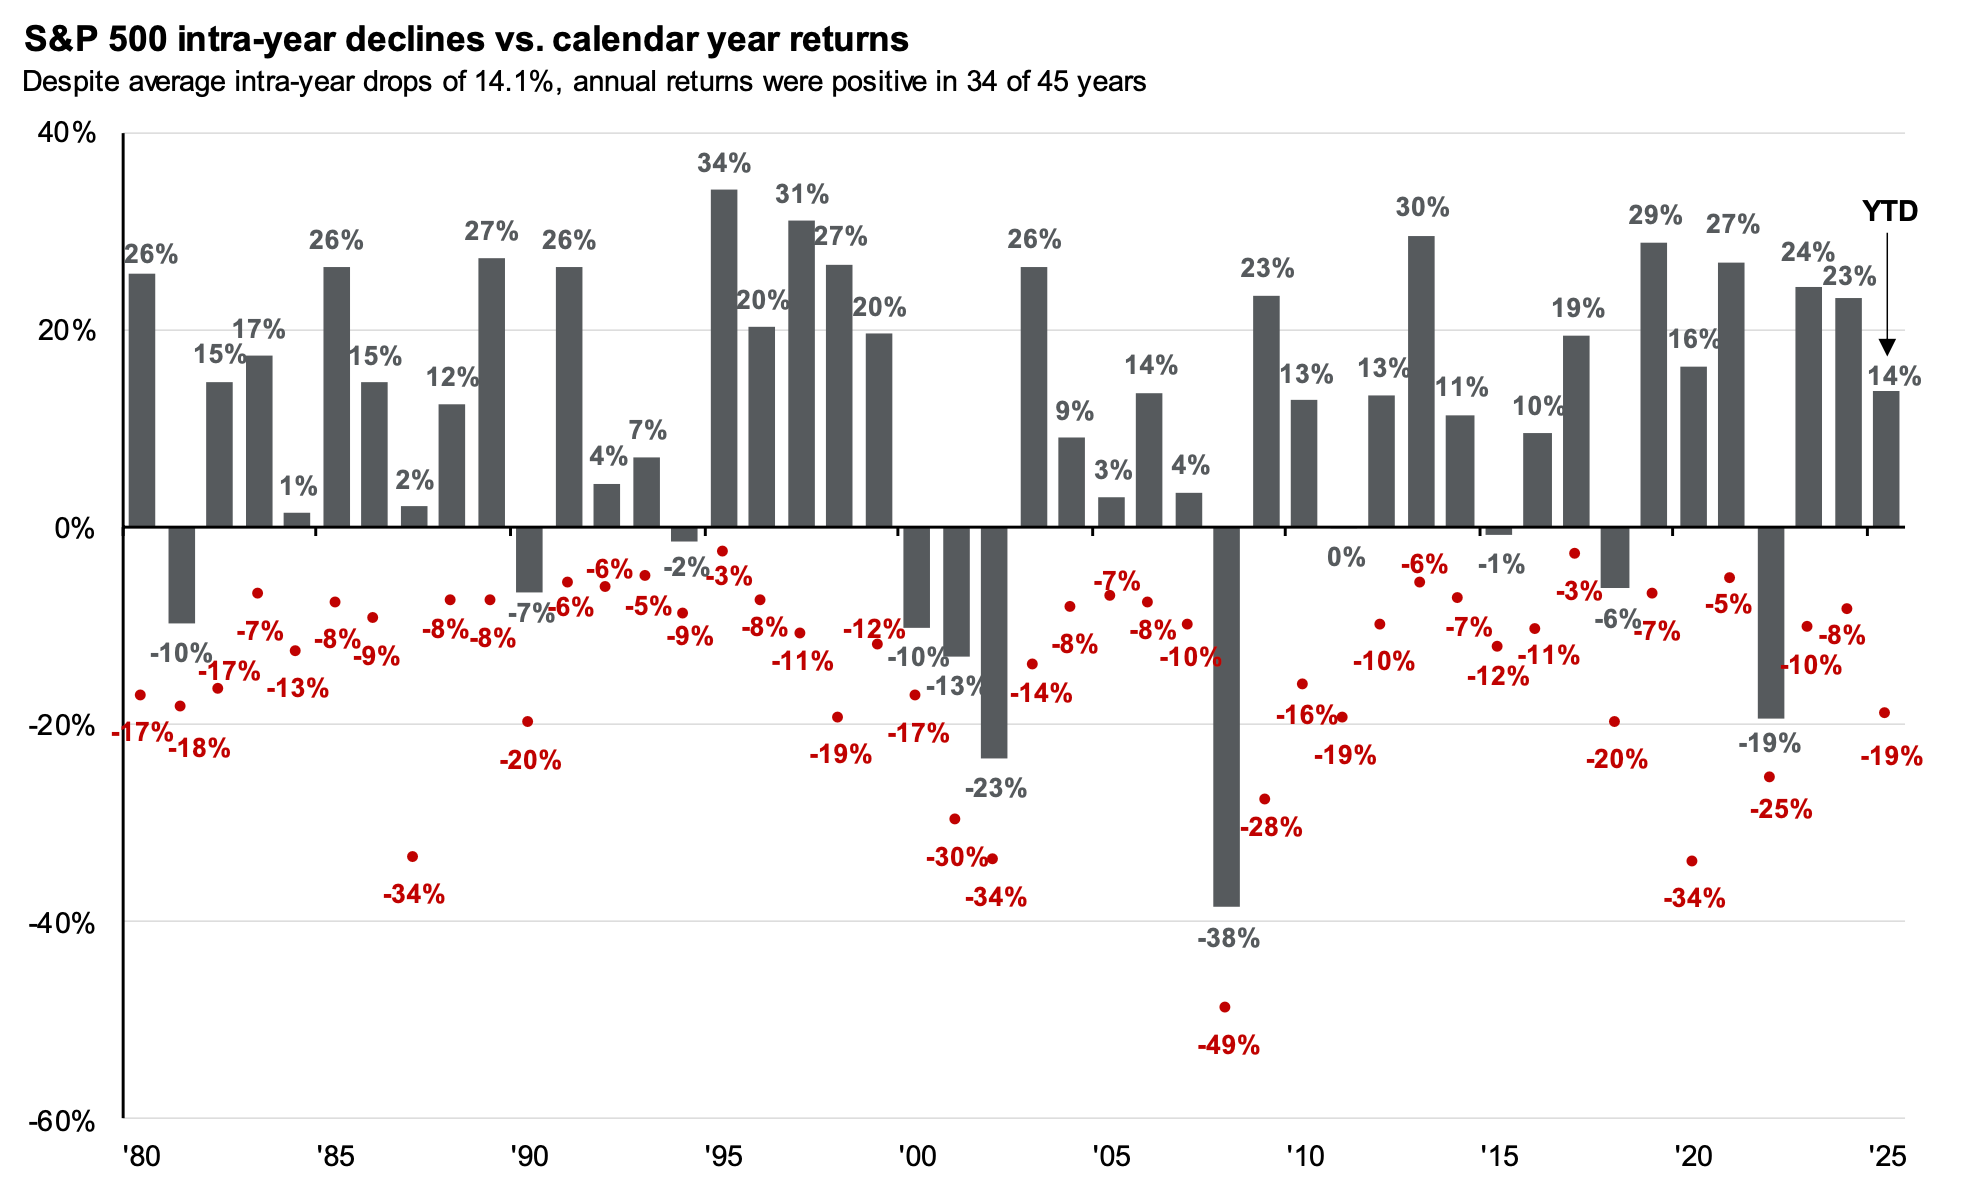
Since 1980, the S&P 500 has experienced an average intra-year max drawdown (i.e., a decline from its high) of 14.2%. In midterm election years, that stat climbs to 18%. We’re currently down 5% from the high.
To make matters worse, the recent spike in energy prices is coming as many economic metrics have cooled. Five of the last nine monthly employment reports showed job losses. Household finances, while generally healthy, have been deteriorating for five years. Real personal consumption continues to grow, but the growth rate has flattened out.
The Iran war and spike in gas prices are already weighing on sentiment. From the University of Michigan’s March Surveys of Consumers: “Consumer sentiment dipped about 2%, reaching its lowest reading of the year. Interviews completed prior to the military action in Iran showed an improvement in sentiment from last month, but lower readings seen during the nine days thereafter completely erased those initial gains. Gasoline prices have exerted the most immediate impact felt by consumers, though the magnitude of pass-through to other prices remains highly uncertain. A broad swath of consumers across incomes, age, and political affiliation all reported declines in expectations for their personal finances, down 7.5% nationally.“
All of this is to say that it has become harder to argue that growth is destiny. I’m not saying that we’re doomed for a recession. But the risk is arguably elevated. And historically, the median S&P 500 price decline around recessions is 24%.
If you’re exposed to the stock market and these stats make you nervous, then you and I are in the same boat.
The question is how you’ll behave when the market volatility picks up. Because if you can’t stomach volatility, then maybe you shouldn’t be in the market.
All of the historical data teaches us that big sell-offs are what investing is all about. And the path to long-term riches is riddled with stomach-churning volatility.
And to be clear, just because things could get worse before they get better doesn’t mean they will.
–
Related from TKer:
I’ll be on “Facts Vs Feelings: Social Hour” with Carson Group’s Ryan Detrick and Sonu Varghese. I’ll be joined by CappThesis’ Frank Cappelleri. The live program will air on YouTube on Friday, March 27, at 3 pm ET.

There were several notable data points and macroeconomic developments since our last review:
Note: Much of the monthly economic data below is derived from surveys conducted before the recent spike in energy prices. The weekly economic data is more current.
⛽️ Gas prices jump. From AAA: “Spring Break season is here as the national average for a gallon of regular gasoline jumped nearly 35 cents since last week. Current prices are similar to the spring of 2024. Gasoline demand increases this time of year as the weather warms up and more drivers hit the road. Crude oil prices play a major role in what drivers pay at the pump, and prices have surpassed the $100/barrel mark multiple times in recent days. To help offset rising prices, the U.S. announced it will release 172 million barrels of oil from its strategic reserves over four months. The move is part of a broader effort by the International Energy Agency to release a total of 400 million barrels of oil, the largest emergency release in its history.”
For more on energy prices, read: Our love-hate relationship with rising oil prices in charts 💔🛢️📊
🎈Consumer price inflation appears to cool. The Consumer Price Index (CPI) rose 2.4% year over year in February, unchanged from the prior month. Adjusted for food and energy prices, core CPI was up 2.5%
On a month-over-month basis, CPI was up 0.3%, and core CPI increased 0.2%. If you annualize the three-month trend in the monthly figures — a reflection of the short-term trend in prices — core CPI climbed 3.0%.
🎈 Fed’s preferred inflation measure could be cooler. The personal consumption expenditures (PCE) price index in January was up 2.8% from a year ago. The core PCE price index — the Federal Reserve’s preferred measure of inflation — was up 3.1% during the month, up from December’s 3.9% rate.
On a month-over-month basis, the core PCE price index was up 0.36%. If you annualize the rolling three-month and six-month figures — a reflection of the near-term trend in prices — the core PCE price index was up 3.7% and 3.1%, respectively.
While inflation rates remain above the Federal Reserve’s 2% target, they are down considerably from peak levels just a few years ago.
For more on the Fed’s impact on markets, read: There’s a more important force than the Fed driving the stock market 💪
🎈 Inflation expectations were mostly unchanged. From the New York Fed’s February Survey of Consumer Expectations: “Median inflation expectations in February declined by 0.1 percentage point at the one-year-ahead horizon to 3.0% and remained steady at the three-year and five-year-ahead horizons at 3.0%.”
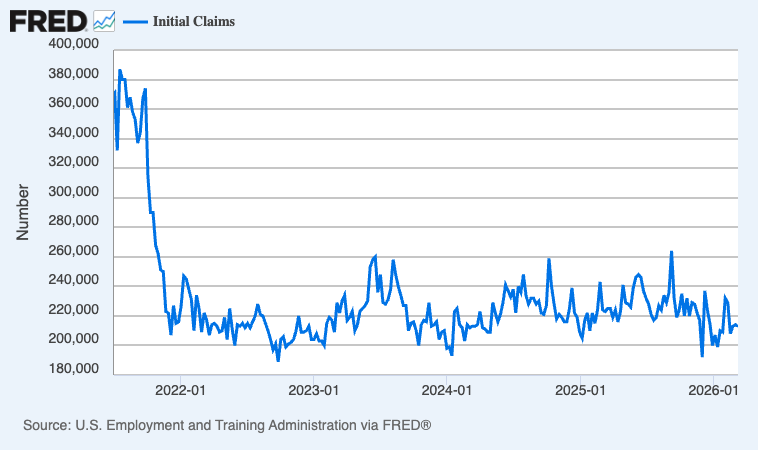
💼 New unemployment insurance claims, total ongoing claims remain low. Initial claims for unemployment benefits declined to 213,000 during the week ending Mar. 7, down from 214,000 the week prior. This metric remains at levels historically associated with economic growth.
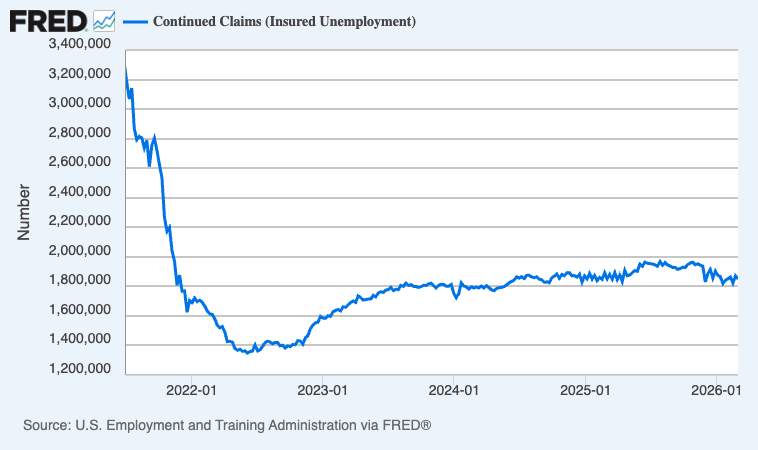
Insured unemployment, which captures those who continue to claim unemployment benefits, declined to 1.85 million during the week ending Feb. 28.
For more on the labor market, read: The next couple of years for the job market could be tough 🫤
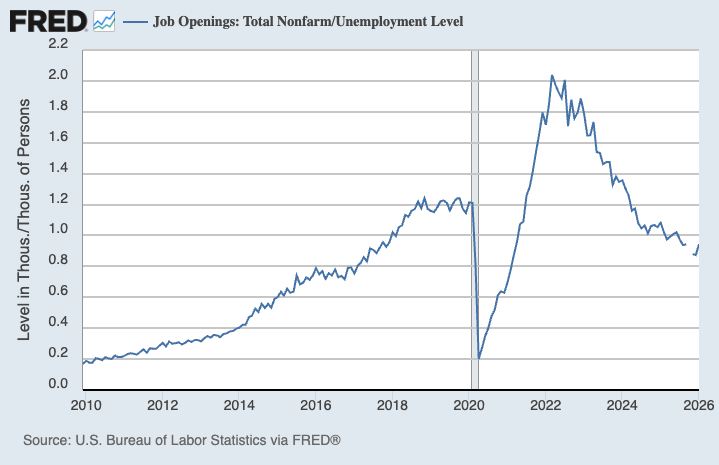
💼 Job openings tick up. According to the BLS’s Job Openings and Labor Turnover Survey, employers had 6.95 million job openings in January, up from 6.55 million in December. This metric is near its lowest point since December 2020.
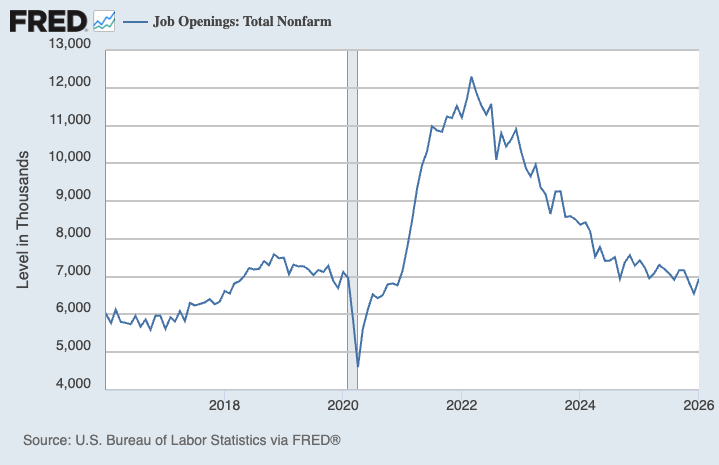
During the month, there were 7.37 million unemployed people — meaning there were 0.94 job openings per unemployed person. This remains one of the most straightforward indicators of labor demand. This metric has returned to prepandemic levels.
For more on job openings, read: Were there really twice as many job openings as unemployed people? 🤨 and Revisiting the key chart to watch amid the Fed’s war on inflation 📈
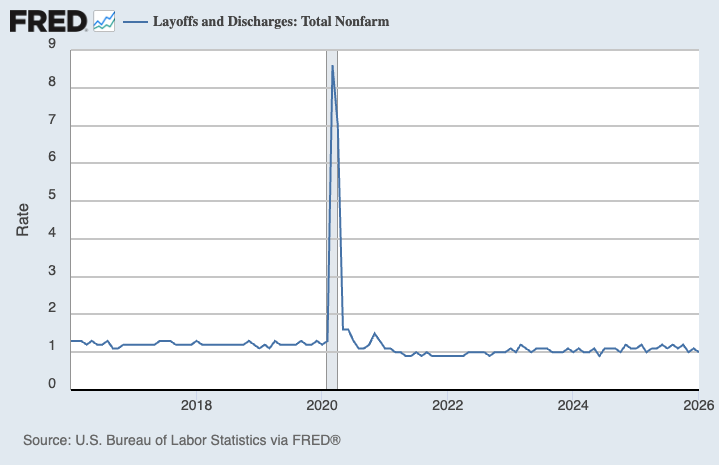
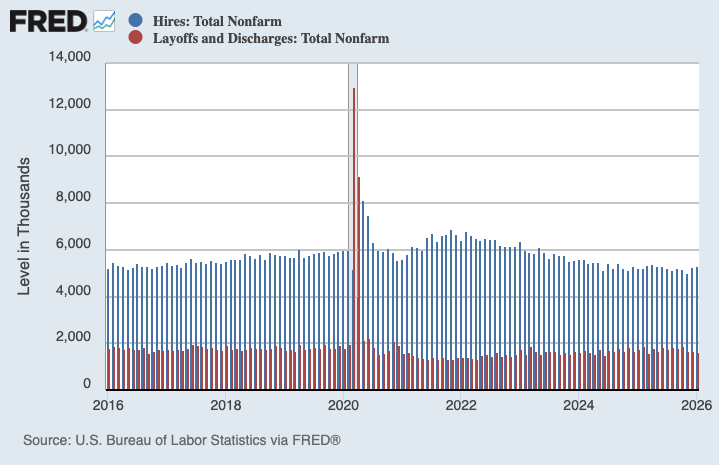
👍 Layoffs remain depressed, hiring remains firm. Employers laid off 1.63 million people in January. While challenging for the people affected, this figure represents just 1.0% of total employment. This metric remains slightly below prepandemic levels.
For more on layoffs, read: Mathematical context can totally change the story 🧮
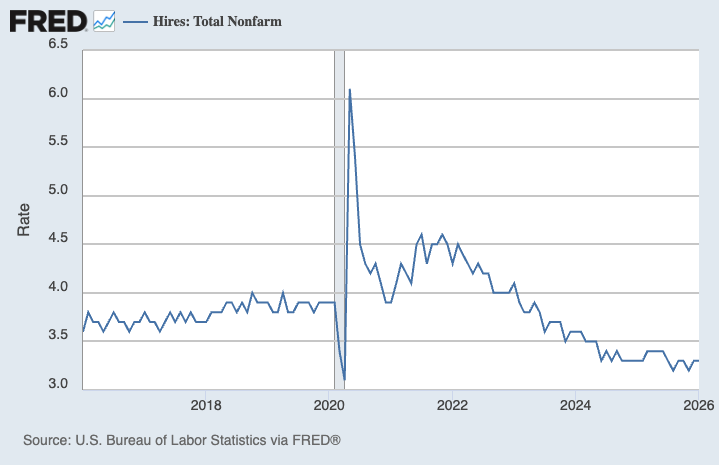
Hiring activity remains well above layoff activity. During the month, employers hired 5.29 million people.
That said, the hiring rate — the number of hires as a percentage of the employed workforce — has been trending lower, which could be a sign of trouble to come in the labor market.
For more on why this metric matters, read: The hiring situation 🧩
🤔 People are quitting less. In January, 3.14 million workers quit their jobs. This represents 2.0% of the workforce. The rate continues to trend below prepandemic levels.
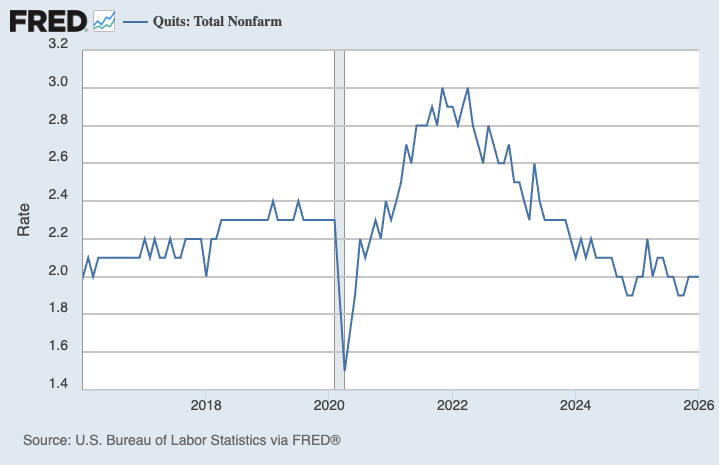
A low quits rate could mean a number of things: more people are satisfied with their job, workers have fewer outside job opportunities, wage growth is cooling, or productivity will improve as fewer people are entering new, unfamiliar roles.
For more on this dynamic, read: The crummy labor market is yielding a ‘tenure dividend’ for corporations 💰
💳 Card spending data is holding up. From JPMorgan: “As of 06 Mar 2026, our Chase Consumer Card spending data (unadjusted) was 6.0% above the same day last year. Based on the Chase Consumer Card data through 06 Mar 2026, our estimate of the US Census February control measure of retail sales m/m is 0.56%.”
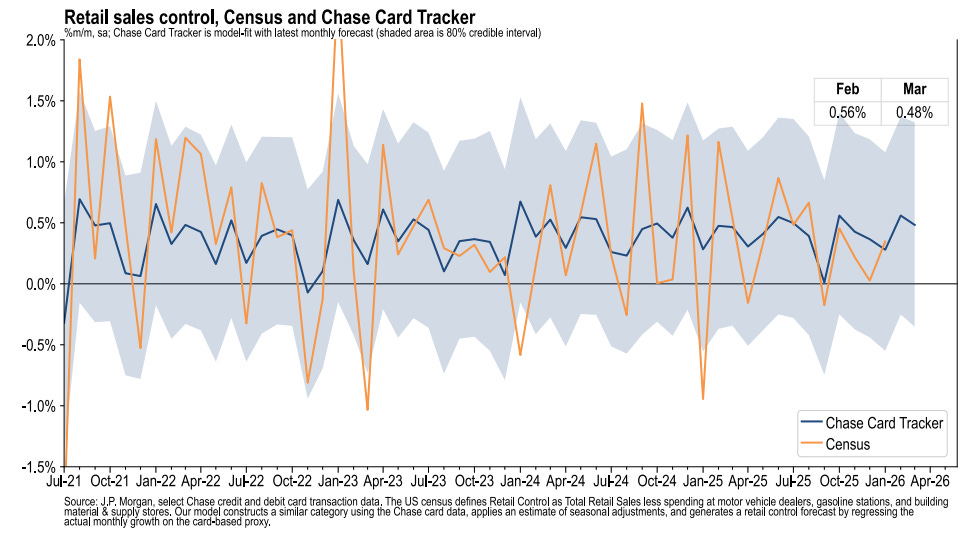
From BofA: “Spending growth was very strong in February, according to Bank of America internal credit and debit card data. The year-over-year (YoY) growth rate rose to 3.2%, the highest in over three years. And on a seasonally-adjusted basis, card spending rose a strong 0.9% month-over-month (MoM).“
Consumer spending data has looked a lot better than consumer sentiment readings. For more on this contradiction, read: We’re taking that vacation whether we like it or not 🛫 and Household finances are both ‘worse’ and ‘good’ 🌦️
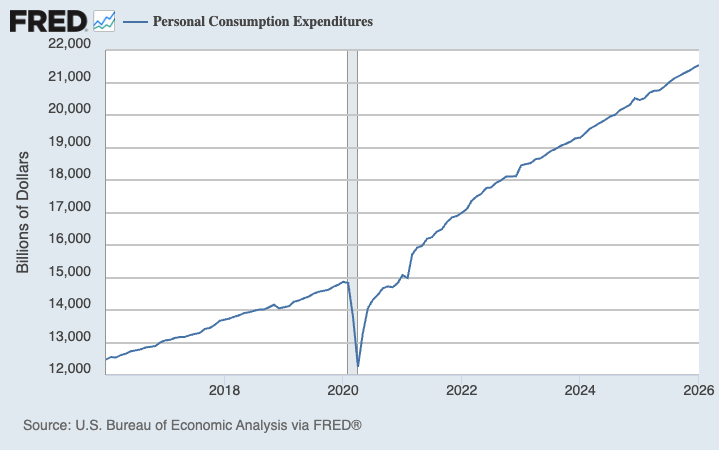
🛍️ Consumer spending ticks higher. According to BEA data, personal consumption expenditures increased 0.4% month-over-month in January to an annual rate of $21.54 trillion, an all-time high.
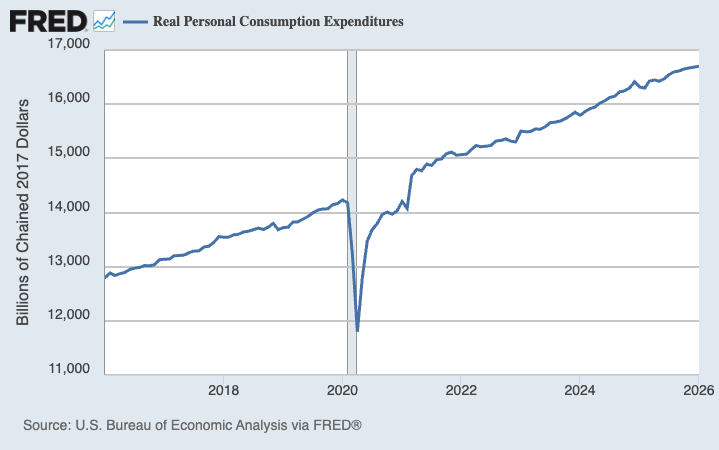
Adjusted for inflation, real personal consumption expenditures increased 0.1% from the prior month to another all-time high.
👎 Small business optimism ticks lower. The NFIB’s Small Business Optimism Index declined to 98.8 in February from 99.3 in January. From the NFIB: “Although optimism declined slightly, small businesses report feeling more certain in February as they look toward the coming months. High sales and increased profits made February a more positive month for many owners, but competition from large businesses is putting stress on Main Street firms as they navigate the current economic climate.”
Keep in mind that during times of perceived stress, soft survey data tends to be more exaggerated than actual hard data.
For more on this, read: What businesses do > what businesses say 🙊 and 4 sometimes-conflicting ways I’m thinking about the economy 😬😞😎🙃
🏚 Home sales ticked higher. Sales of previously owned homes fell 1.7% in February to an annualized rate of 4.09 million units. From NAR chief economist Lawrence Yun: “Housing affordability is improving, and consumers are responding. Still, there is a long way to go to return to pre-pandemic levels of transaction activity. There are more than 6 million more jobs than in 2019, yet home sales per year are down by one million.”
Prices for previously owned homes rose from last month and year-ago levels. From the NAR: “The median existing-home sales price for all housing types in February was $398,000, up 0.3% from one year ago ($396,800) – the 32nd consecutive month of year-over-year price increases.”
From Yun: “Inventory is growing, but sluggishly. If demand picks up notably in the coming months and outpaces supply growth, home prices will inevitably rise. That is why increasing supply is so important to help limit home price growth, improve housing affordability, and boost transactions.”
🔨 New home construction starts rise. Housing starts rose 7.2%% in January to an annualized rate of 1.49 million units, according to the Census Bureau. Building permits declined 5.4% to an annualized rate of 1.38 million units.
🏠 Mortgage rates rise. According to Freddie Mac, the average 30-year fixed-rate mortgage rose to 6.11%, up from 6.00% last week: “Despite the modest uptick, buyers are responding to rates in this range, with existing-home sales increasing 1.7% in February. Purchase applications also increased this week, a welcome sign as buyers enter spring homebuying season with rates down more than half a percentage point compared to the same time last year.”
As of Q4, there were 148.7 million housing units in the U.S., of which 87.8 million were owner-occupied and about 40% were mortgage-free. Of those carrying mortgage debt, almost all have fixed-rate mortgages, and most of those mortgages have rates that were locked in before rates surged from 2021 lows. All of this is to say: Most homeowners are not particularly sensitive to the small weekly movements in home prices or mortgage rates.
For more on mortgages and home prices, read: Why home prices and rents are creating all sorts of confusion about inflation 😖
🏭 Business investment activity holds at record levels. Orders for nondefense capital goods excluding aircraft — a.k.a. core capex or business investment — declined marginally from its December peak to $79.27 billion in January.
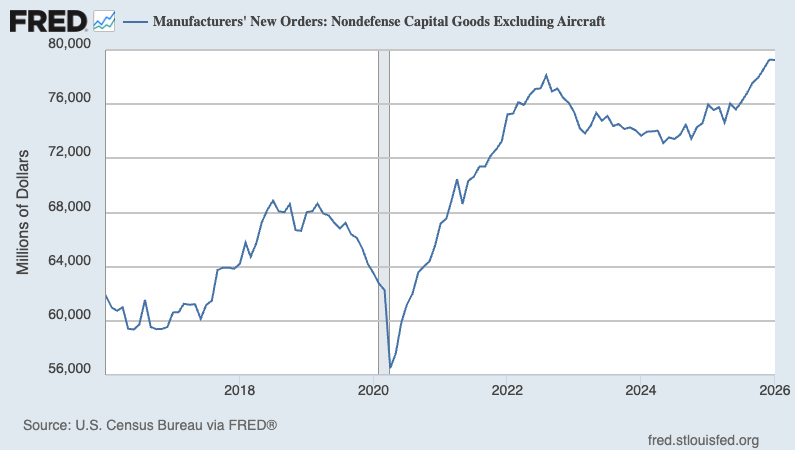
Core capex orders are a leading indicator, meaning they foretell economic activity down the road.
📈 Near-term GDP growth estimates are tracking positively. The Atlanta Fed’s GDPNow model sees real GDP growth rising at a 2.7% rate in Q1.
For more on GDP and the economy, read: It’s too ambiguous to just say ‘the economy’ 🤦🏻♂️ and Economic data can often be both ‘worse’ and ‘good’ 🌦️
Earnings look bullish: The long-term outlook for the stock market remains favorable, bolstered by expectations for years of earnings growth. And earnings are the most important driver of stock prices.
Demand is positive: Demand for goods and services remains positive, supported by healthy consumer and business balance sheets. Job creation has cooled, hovering at near-zero. But the Federal Reserve — having resolved the inflation crisis — shifted its focus toward supporting the labor market.
Growth is cooling: While the economy remains healthy, growth has normalized from much hotter levels earlier in the cycle. The economy is less “coiled” these days as major tailwinds like excess job openings and core capex orders have faded. It has become harder to argue that growth is destiny.
Actions speak louder than words: We are in an odd period, given that the hard economic data decoupled from the soft sentiment-oriented data. Consumer and business sentiment has been relatively poor, even as tangible consumer and business activity continues to grow and trend at record levels. From an investor’s perspective, what matters is that the hard economic data continues to hold up.
Stocks are not the economy: There’s a case to be made that the U.S. stock market could outperform the U.S. economy in the near term, thanks largely to positive operating leverage. Since the pandemic, companies have aggressively adjusted their cost structures. This came with strategic layoffs and investment in new equipment, including hardware powered by AI. These moves are resulting in positive operating leverage, which means a modest amount of sales growth — in the cooling economy — is translating to robust earnings growth.
Mind the ever-present risks: Of course, we should not get complacent. There will always be risks to worry about, such as U.S. political uncertainty, geopolitical turmoil, energy price volatility, and cyber attacks. There are also the dreaded unknowns. Any of these risks can flare up and spark short-term volatility in the markets.
Investing is never a smooth ride: There’s also the harsh reality that economic recessions and bear markets are developments that all long-term investors should expect as they build wealth in the markets. Always keep your stock market seat belts fastened.
Think long-term: For now, there’s no reason to believe there’ll be a challenge that the economy and the markets won’t overcome. The long game remains undefeated, and it’s a streak that long-term investors can expect to continue.
For more on how the macro story is evolving, check out the previous review of the macro crosscurrents. »
Here’s a roundup of some of TKer’s most talked-about paid and free newsletters about the stock market. All of the headlines are hyperlinked to the archived pieces.
The stock market can be an intimidating place: It’s real money on the line, there’s an overwhelming amount of information, and people have lost fortunes in it very quickly. But it’s also a place where thoughtful investors have long accumulated a lot of wealth. The primary difference between those two outlooks is related to misconceptions about the stock market that can lead people to make poor investment decisions.
Passive investing is a concept usually associated with buying and holding a fund that tracks an index. And no passive investment strategy has attracted as much attention as buying an S&P 500 index fund. However, the S&P 500 — an index of 500 of the largest U.S. companies — is anything but a static set of 500 stocks.

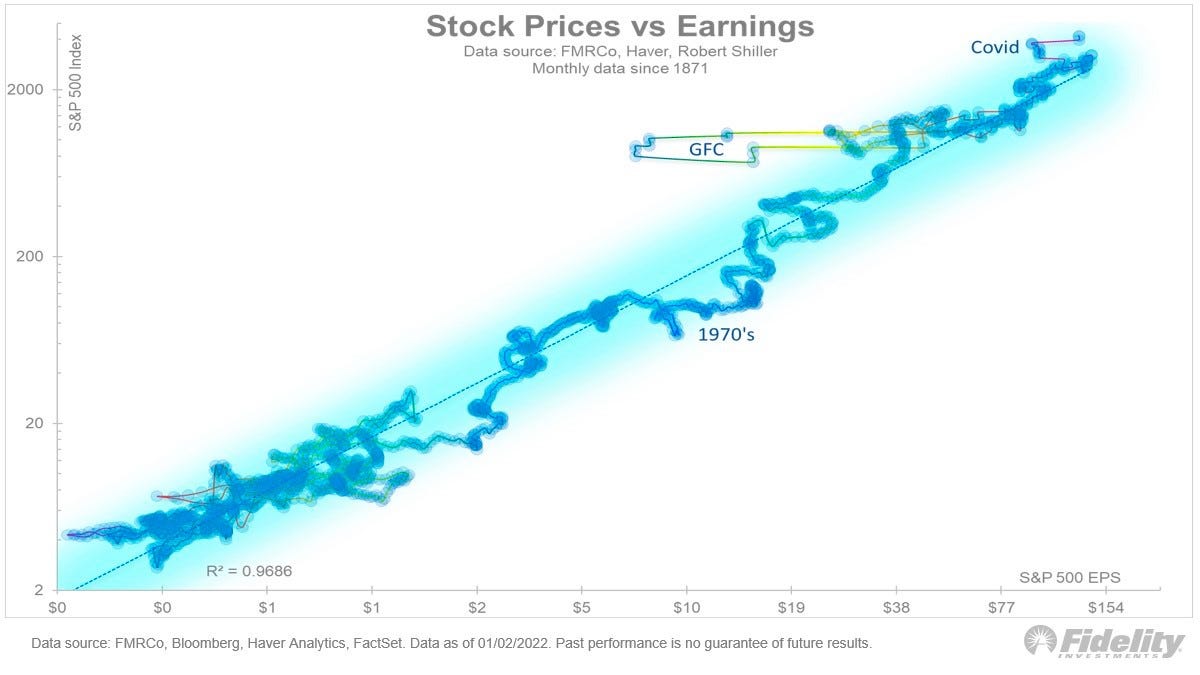
For investors, anything you can ever learn about a company matters only if it also tells you something about earnings. That’s because long-term moves in a stock can ultimately be explained by the underlying company’s earnings, expectations for earnings, and uncertainty about those expectations for earnings. Over time, the relationship between stock prices and earnings has a very tight statistical relationship.
Investors should always be mentally prepared for some big sell-offs in the stock market. It’s part of the deal when you invest in an asset class that is sensitive to the constant flow of good and bad news. Since 1950, the S&P 500 has seen an average annual max drawdown (i.e., the biggest intra-year sell-off) of 14%.
Every recession in history was different. And the range of stock performance around them varied greatly. There are two things worth noting. First, recessions have always been accompanied by a significant drawdown in stock prices. Second, the stock market bottomed and inflected upward long before recessions ended.

Since 1928, the S&P 500 has generated a positive total return more than 89% of the time over all five-year periods. Those are pretty good odds. When you extend the timeframe to 20 years, you’ll see that there’s never been a period where the S&P 500 didn’t generate a positive return.
While a strong dollar may be great news for Americans vacationing abroad and U.S. businesses importing goods from overseas, it’s a headwind for multinational U.S.-based corporations doing business in non-U.S. markets.

…you don’t want to buy them when earnings are great, because what are they doing when their earnings are great? They go out and expand capacity. Three or four years later, there’s overcapacity and they’re losing money. What about when they’re losing money? Well, then they’ve stopped building capacity. So three or four years later, capacity will have shrunk and their profit margins will be way up. So, you always have to sort of imagine the world the way it’s going to be in 18 to 24 months as opposed to now. If you buy it now, you’re buying into every single fad every single moment. Whereas if you envision the future, you’re trying to imagine how that might be reflected differently in security prices.
Some event will come out of left field, and the market will go down, or the market will go up. Volatility will occur. Markets will continue to have these ups and downs. … Basic corporate profits have grown about 8% a year historically. So, corporate profits double about every nine years. The stock market ought to double about every nine years… The next 500 points, the next 600 points — I don’t know which way they’ll go… They’ll double again in eight or nine years after that. Because profits go up 8% a year, and stocks will follow. That’s all there is to it.
Long ago, Sir Isaac Newton gave us three laws of motion, which were the work of genius. But Sir Isaac’s talents didn’t extend to investing: He lost a bundle in the South Sea Bubble, explaining later, “I can calculate the movement of the stars, but not the madness of men.” If he had not been traumatized by this loss, Sir Isaac might well have gone on to discover the Fourth Law of Motion: For investors as a whole, returns decrease as motion increases.
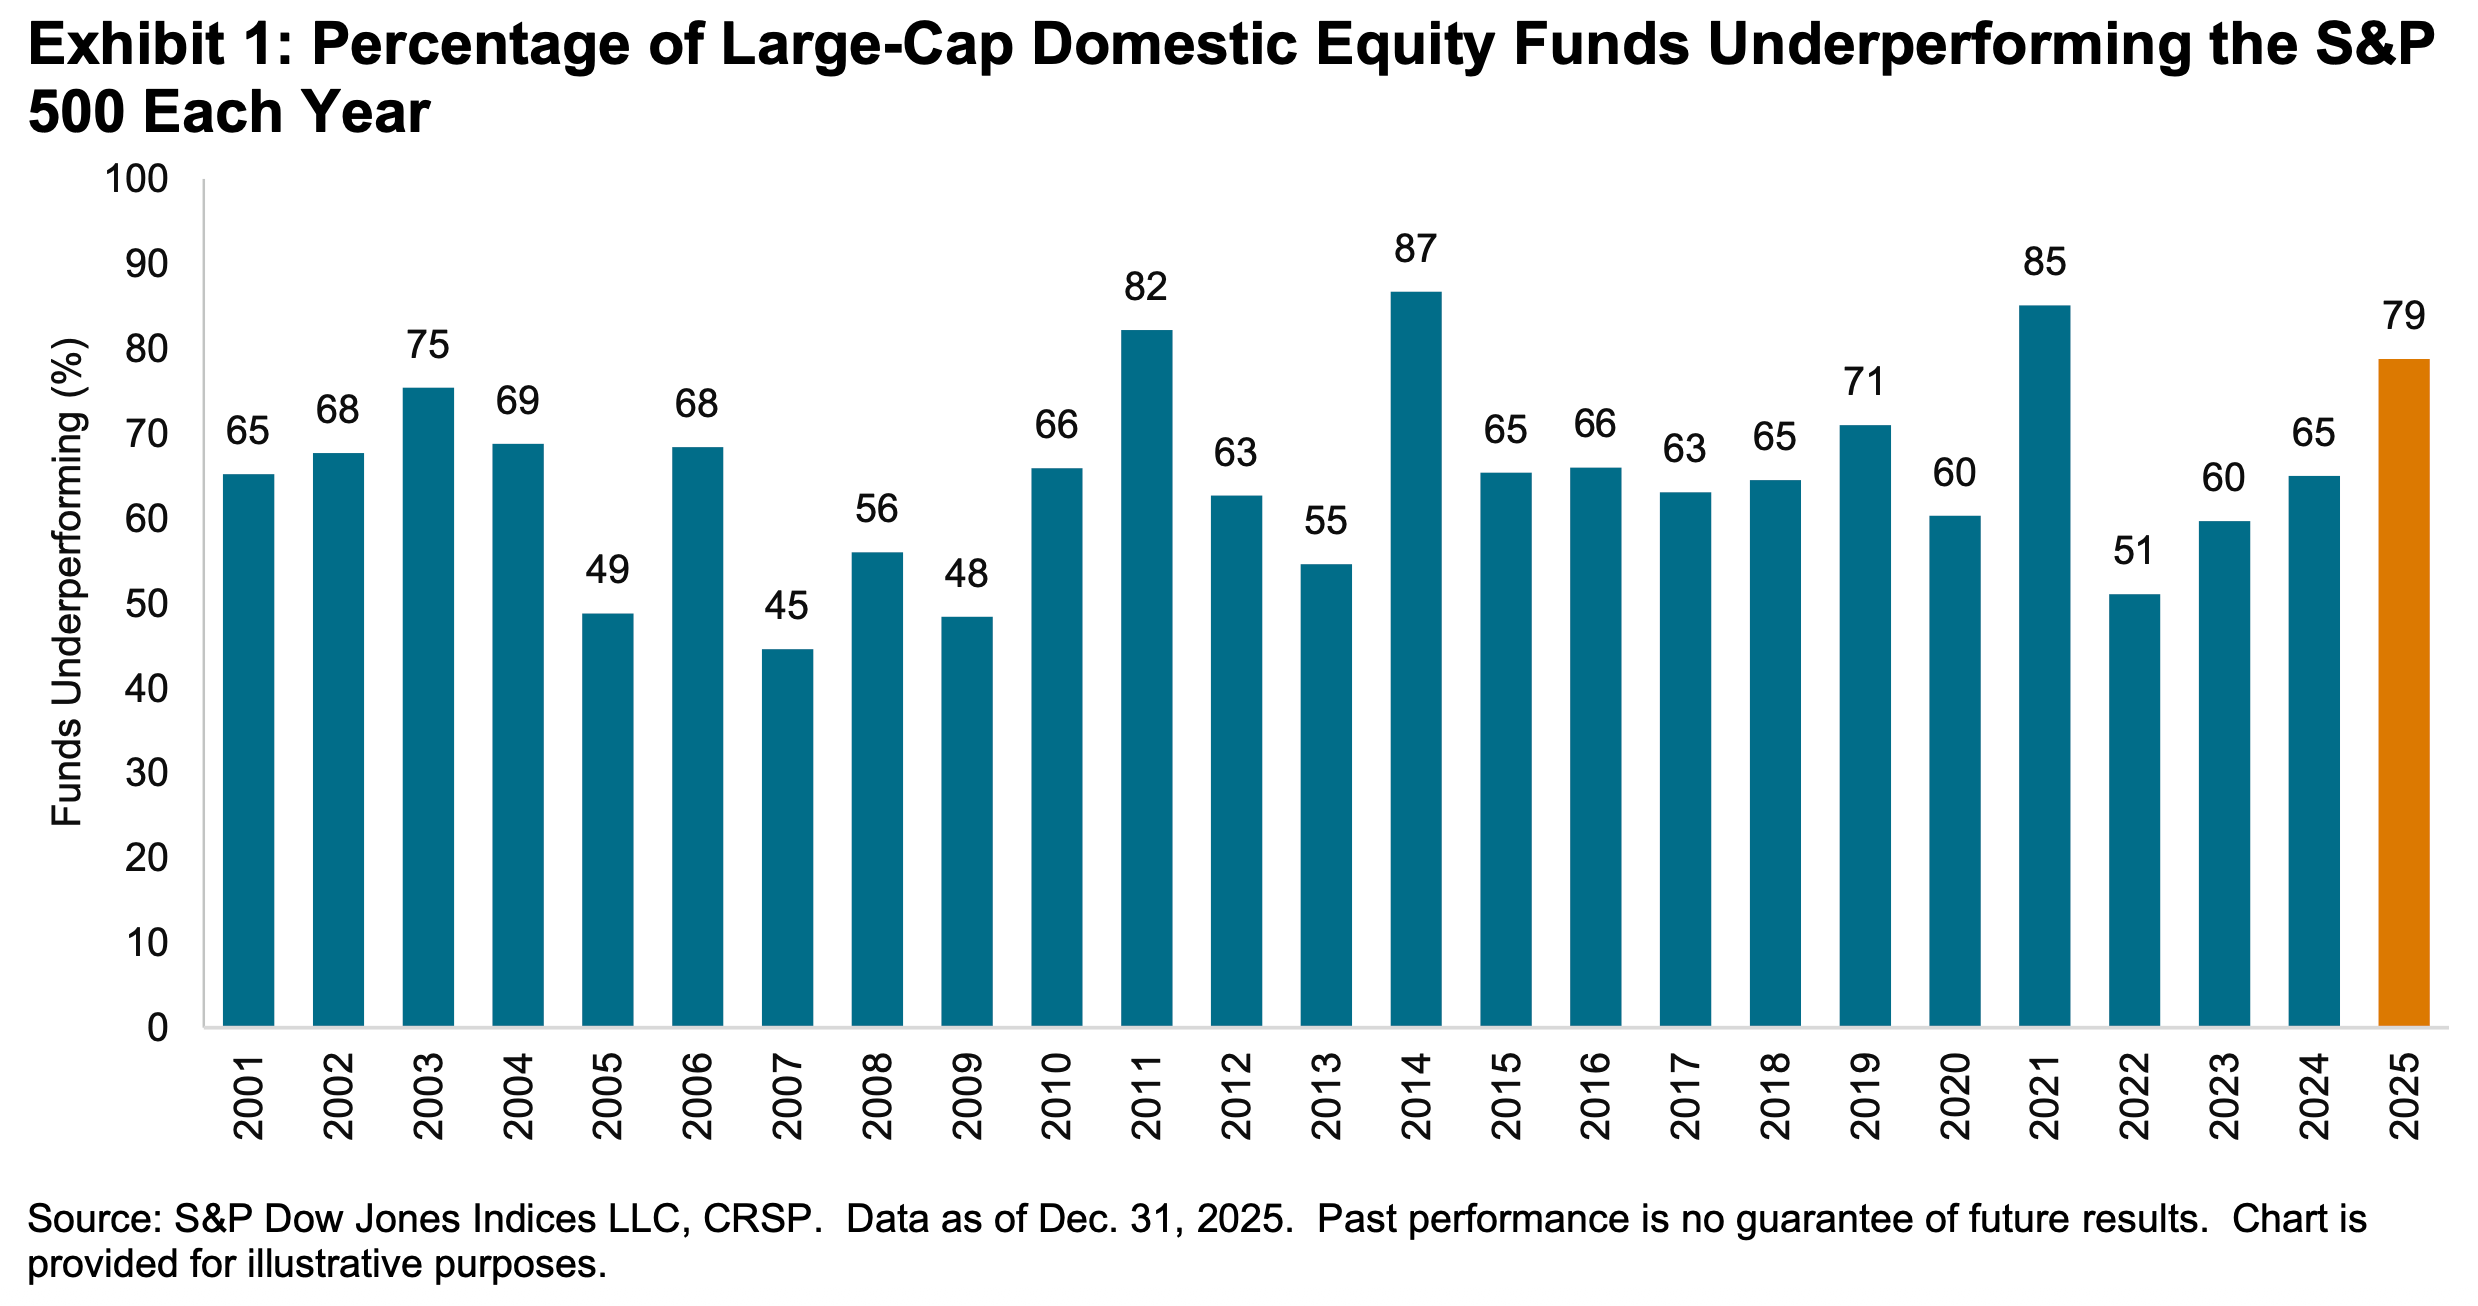
According to S&P Dow Jones Indices (SPDJI), 79% of U.S. large-cap equity fund managers underperformed the S&P 500 in 2025. As you stretch the time horizon, the numbers get even more dismal. Over three years, 67% underperformed. Over 5 years, 89% underperformed. And over 20 years, 93% underperformed. This 2025 performance was the 16th consecutive year in which the majority of fund managers in this category have lagged the index.
Even if you are a fund manager who generated industry-leading returns in one year, history says it’s an almost insurmountable task to stay on top consistently in subsequent years. According to S&P Dow Jones Indices, just 4.21% of all U.S. equity funds in the top half of performance during the first year were able to remain in the top during the four subsequent years. Only 2.42% of U.S. large-cap funds remained in the top half
SPDJI’s report also considered fund performance relative to their benchmarks over the past three years. Of 738 U.S. large-cap equity funds tracked by SPDJI, 50.68% beat the S&P 500 in 2022. Just 5.08% beat the S&P in the two years ending 2023. And only 2.14% of the funds beat the index over the three years ending in 2024.

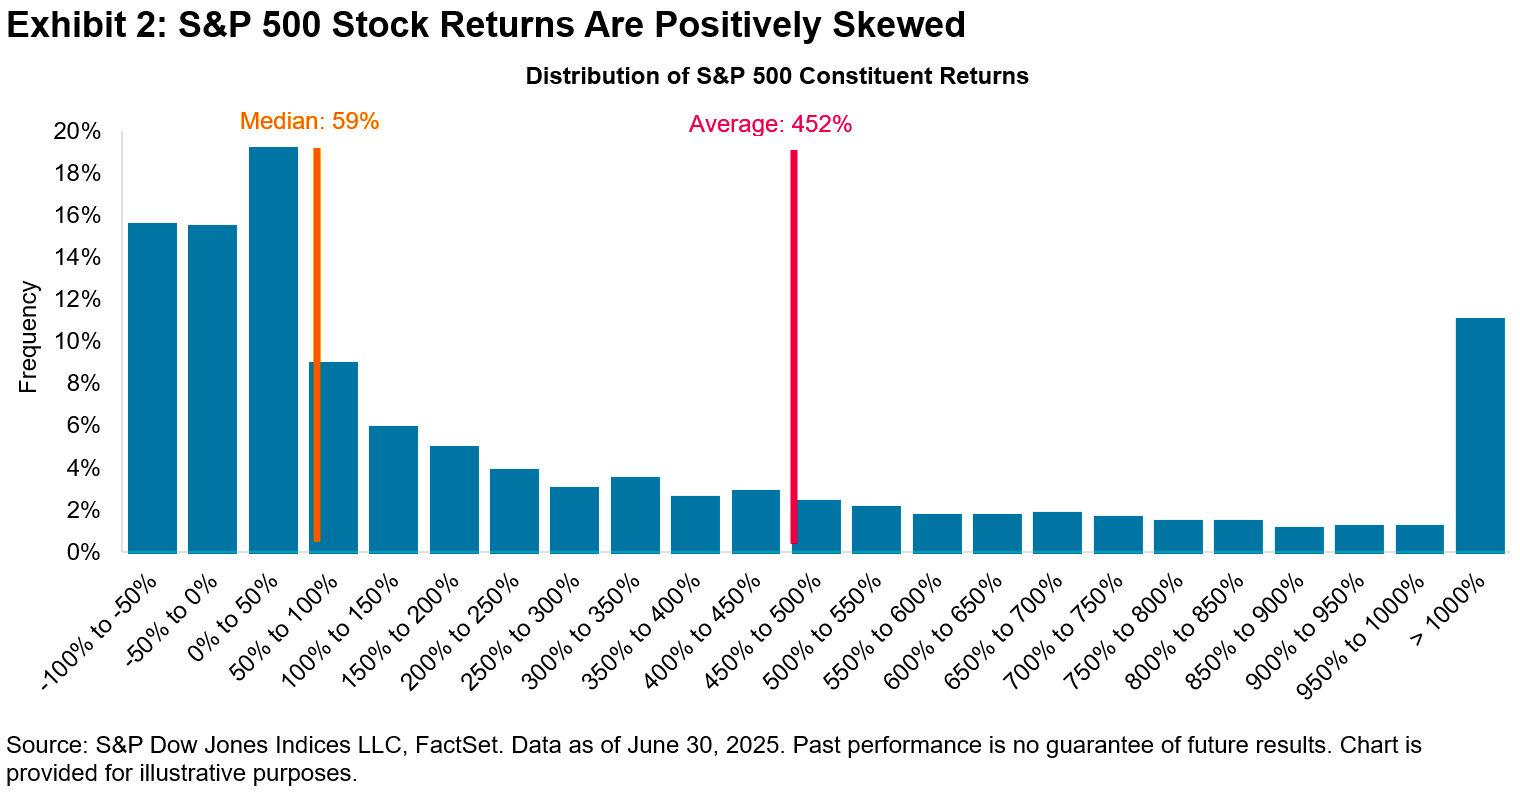
Picking stocks in an attempt to beat market averages is an incredibly challenging and sometimes money-losing effort. Most professional stock pickers aren’t able to do this consistently. One of the reasons for this is that most stocks don’t deliver above-average returns. According to S&P Dow Jones Indices, only 19% of the stocks in the S&P 500 outperformed the average stock’s return from 2001 to 2025. Over this period, the average return on an S&P 500 stock was 452%, while the median stock rose by just 59%.