- The Gold weekly forecast remains positive as macro dynamics favor gold’s broad uptrend.
- Fed easing and geopolitics continue to provide a floor under the gold price.
- The technical bias for gold remains bearish, awaiting a breakout near the 20-day MA.
The gold price ended last week on a steady footing, closing the year with an exceptional 65% return. After an aggressive rally in the previous few months, the precious metal pared some of its gains as traders took profits and reevaluated the interest rate outlook, inflation, and the US dollar. The pullback in gold prices stays within the broad uptrend.
–Are you interested in learning more about forex indicators? Check our detailed guide-
The key driver behind gold’s resilience has remained the same for months, with the lowering of US interest rates. The US dollar closed the year with its sharpest annual decline in eight years, and this weakness kept gold prices well bid. Moreover, the softer US labor market data last week reinforced the narrative of Fed easing through 2026. This holds real yields under pressure, maintaining gold’s traction as a non-yielding asset.
Meanwhile, the safe-haven demand for gold also remains intact amid ongoing geopolitical tensions in the Middle East, Russia, and particularly in the US. Central bank buying also provides a floor to the gold, making each dip a buying opportunity.
Looking ahead, the next week could be critical for near-term direction. Gold now needs a strong catalyst to resume its advance after the consolidation. If the incoming US data points to slower growth and easing inflation, gold could pick up momentum quickly. On the other hand, stronger-than-expected figures could trigger a deeper correction as expectations for rate cuts fade.
Volatility is expected to remain elevated as liquidity returns in full after the holidays. Traders will closely watch whether the dips continue attracting buyers or not. As long as the gold holds above key levels, the price will remain constructive even if the path is uneven.
Key Events to Watch Next Week
- US ISM Manufacturing PMI (Monday)
- US ISM Services PMI (Tuesday)
- ADP Employment Report & JOLTS Job Openings (Wednesday)
- Weekly Jobless Claims (Thursday)
- US NFP (Friday)
- Prelim UoM Consumer Sentiment (Friday)
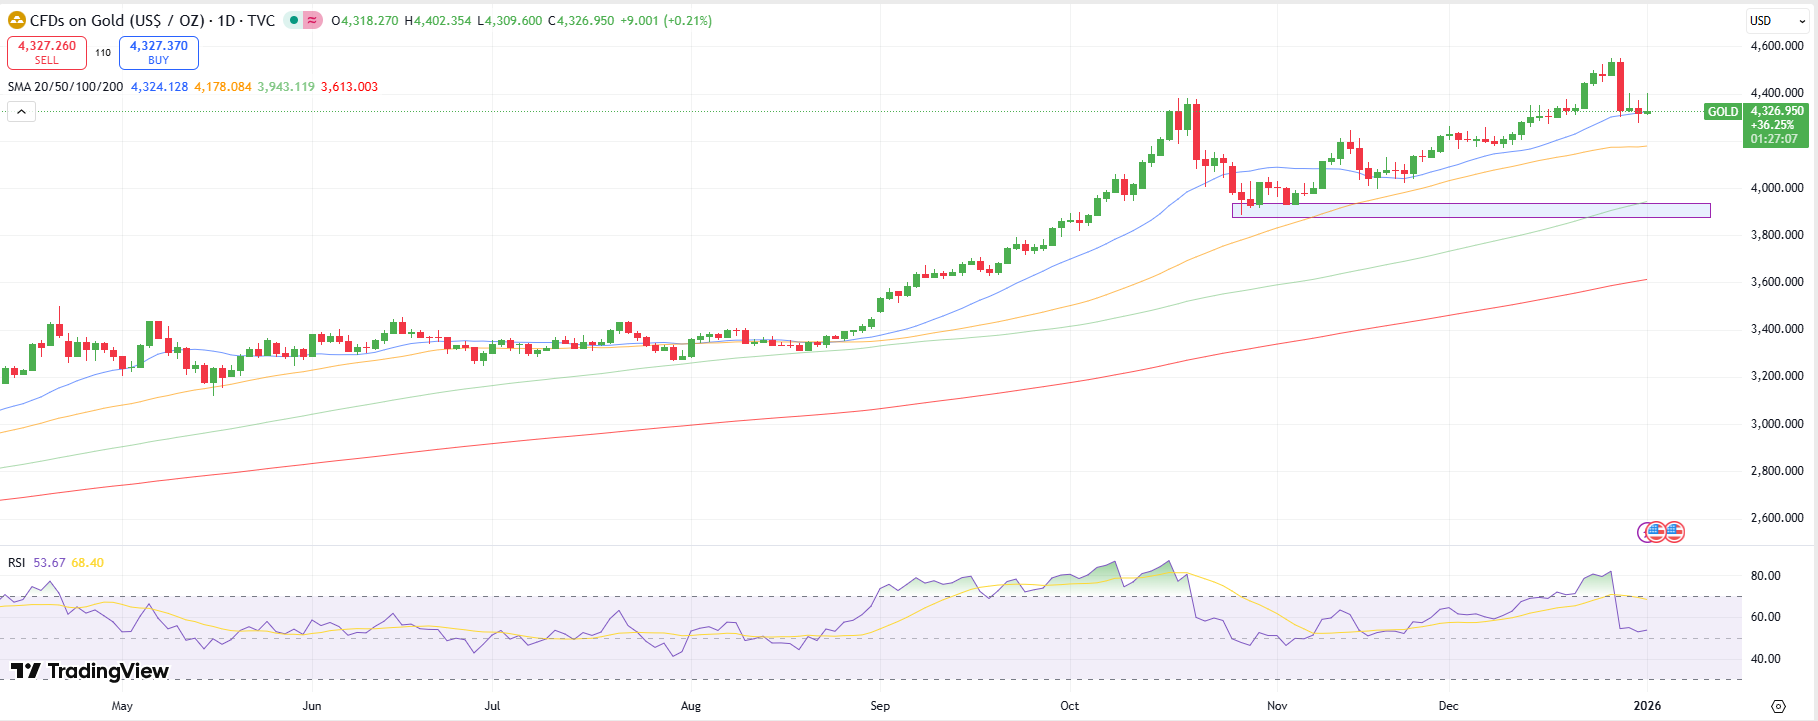
Gold Weekly Technical Forecast: Make or Break at 20-DMA

The daily chart for gold shows a strong bearish bias as the price formed a bearish engulfing candle followed by bearish pinbars near the 20-day MA at $4,315. A sustained move below the level could push to the 50-day MA at $4,180, ahead of the confluence at the 100-day MA and the October lows around $3,930.
–Are you interested in learning more about next cryptocurrency to explode? Check our detailed guide-
On the other hand, moving above the 20-day MA could attract buyers and prompt a test of $4,400 ahead of all-time highs at $4,550. The RSI remains flat above 50.0, suggesting consolidation before a breakout.
Looking to trade forex now? Invest at eToro!
68% of retail investor accounts lose money when trading CFDs with this provider. You should consider whether you can afford to take the high risk of losing your money.
