AUD/USD: Finding a Bottom at Last?
The price of this currency pair has been doing little for several days, just trading within a predictable consolidative band. It looks quiet, but this could be the calm before the storm. This is because both currencies are taking a break from movement, but both could move quite dramatically, especially if there is a full return to war between the USA and Iran – or at least, if the Strait of Hormuz remains effectively closed indefinitely. There are good reasons why there remains plenty of risk to the downside in this currency pair.
What is bringing things close to a boil in the AUD/USD currency pair, is the deterioration of the ceasefire and Memorandum of Understanding between the USA and Iran. This was entirely predictable, but somehow foolishness and wishful thinking was allowed to prevail in the White House, and the Americans have given a lot of leverage to Iran in their Quixotic pursuit of a “good deal”, which will never happen. Naturally, the two countries are increasingly fighting over the Strait of Hormuz, as closing it (it is closed now) boosts the price of crude oil, boosts risk-off sentiment, and risks feeding inflationary pressures into the global economy meaning higher rates. We are getting to a point where a return to full-scale war or at least indefinite closure of the Strait can start to trigger a major movement in this currency pair.
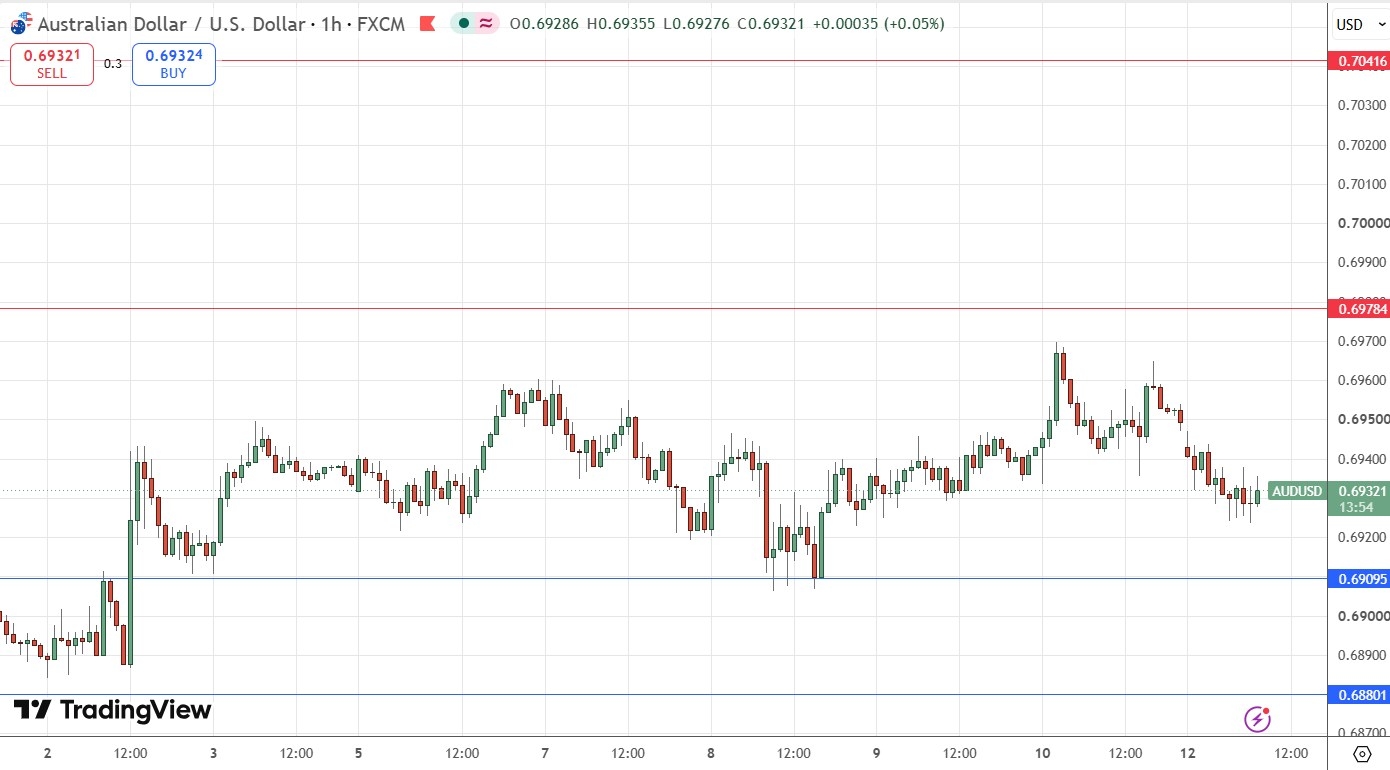
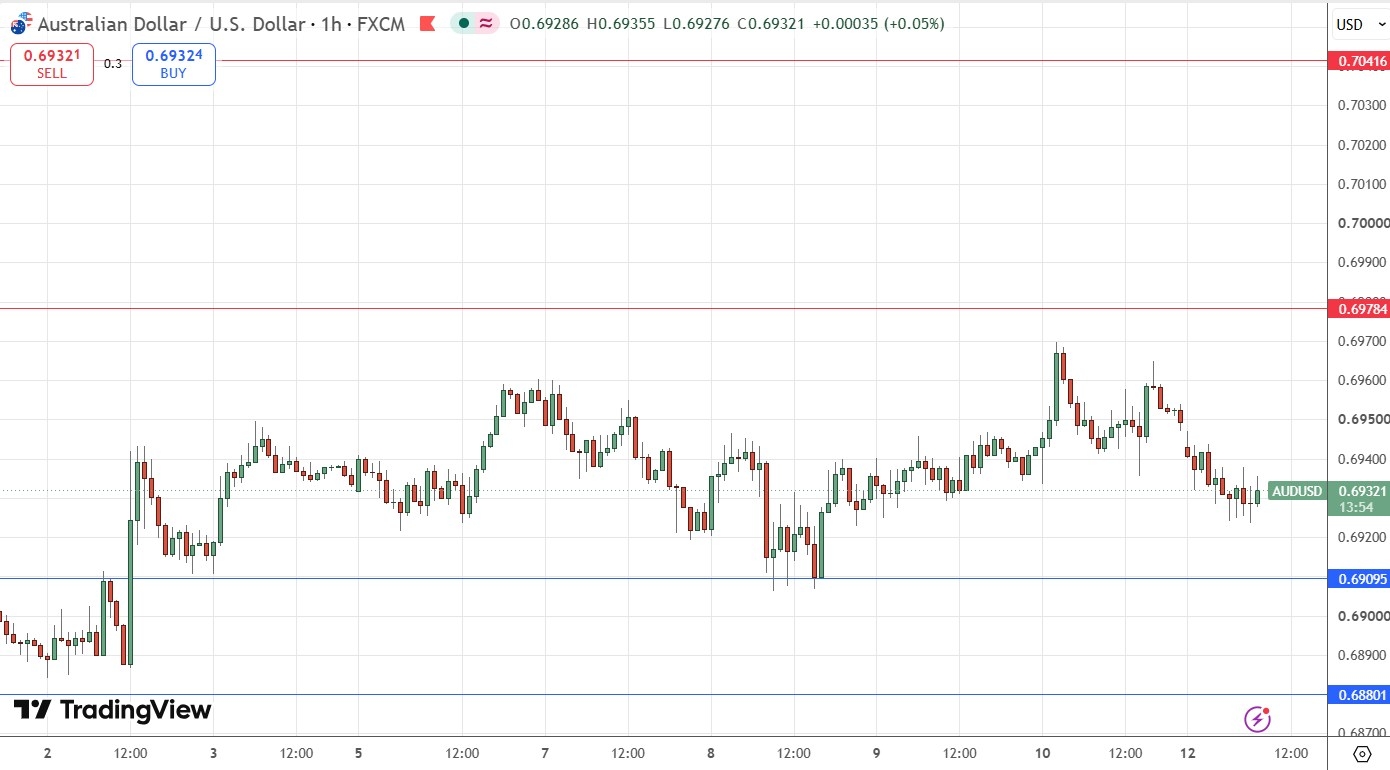
Looking at the price chart below, we can see that the price has been trading sideways for longer than a week, between support just above $0.6900 and $0.6978. Price action has been relatively quiet. This comes at the end of a downwards move where this pair was in a lot of focus, although zooming out to see the long term will show you that the price is close to sitting on the 50-day EMA, so the big picture is more of a long-term bullish trend which might have died.
The US Dollar Index remains within sight of its recent 13-month high but continues to be held down by the robust resistance level at 101.39.
As the price fell into this area of consolidation, until it breaks above $0.6978 it should be treated as a bearish consolidation. This gives two potential trade options: either a short trade entry once the price gets established below the round number at $0.6900, or a short trade following an advance to $0.6978 which creates a failed test of that level from below.
My Take on AUD/USD
This currency pair tends to trade better on breakouts than pullbacks, as it has relatively thin liquidity. This means that the ideal trade set up today will be a bearish breakdown below the support level at $0.6909 and the round number just a few pips below that at $0.6900.
The question is how to determine that the breakdown is reasonably solid, or at least solid enough to trade, once it gets below $0.6900. My preferred method is to wait for two consecutive lower hourly closes below $0.6900, without significant lower wick on the second candlestick.
It is important to be sure that the reward to risk looks acceptable before entering. This usually means that the price should not be too far below $0.6900 when you enter.
Review, Support & Resistance Levels
My previous AUD/USD signal on 1st July was not triggered, as unfortunately the price never quite reached the support level at $0.6880.
Risk 0.25%.
Trades may only be entered prior to 5pm Tokyo time Tuesday.
Short Trade Idea
-
Short entry following a bearish price action reversal on the H1 time frame immediately upon the next touch of $0.6978.
-
Put the stop loss 1 pip above the local swing high.
-
Move the stop loss to break even once the trade is 20 pips in profit.
-
Remove 50% of the position as profit when the price reaches 20 pips in profit and leave the remainder of the position to ride.
Long Trade Idea
-
Long entry following a bullish price action reversal on the 1H1 time frame H1H1H1 time frame immediately upon the next touch of $0.6909.
-
Put the stop loss 1 pip below the local swing low.
-
Move the stop loss to break even once the trade is 20 pips in profit.
-
Remove 50% of the position as profit when the price reaches 20 pips in profit and leave the remainder of the position to ride.
The best method to identify a classic “price action reversal” is for an hourly candle to close, such as a pin bar, a doji, an outside or even just an engulfing candle with a higher close. You can exploit these levels or zones by watching the price action that occurs at the given levels.
There is nothing of high importance scheduled today concerning either the Australian Dollar or the US Dollar.
Ready to trade our daily Forex signals? Here is our list of the top 10 Forex brokers worth reviewing.