China Resources Building Materials Technology Holdings (SEHK:1313) has approved a final ordinary dividend of HK$0.024 per share for the 2025 financial year, with payment scheduled for 22 July 2026.
See our latest analysis for China Resources Building Materials Technology Holdings.
The HK$1.25 share price has been under pressure, with the 30 day share price return down 10.07% and the year to date share price return down 21.88%. The 1 year total shareholder return has declined 23.20%, signalling weak momentum despite the newly approved dividend.
If this payout has you reviewing the wider market, it could be worth scanning for other income or recovery ideas using our screener of 102 top founder-led companies
With the share price under pressure despite the approved dividend and an indicated gap to some analysts’ valuation estimates, you need to ask: is China Resources Building Materials Technology stock being overlooked, or is the market already pricing in its future growth?
Price-to-Earnings of 40.9x: Is it justified?
China Resources Building Materials Technology Holdings trades on a P/E of 40.9x, while also trading below some DCF and analyst value estimates, which sends mixed valuation signals at the HK$1.25 share price.
The P/E multiple compares the current share price with earnings per share and is widely used for companies like this that already report positive earnings. A higher P/E often implies the market is factoring in stronger future earnings or treating current earnings as temporarily depressed.
Here the current P/E of 40.9x is well above the Asian Basic Materials industry average of 14.2x. It is also above the estimated fair P/E of 15.6x that the SWS fair ratio suggests the market could gravitate toward. That gap points to a rich earnings multiple relative to both peers and the level implied by the fair ratio model.
Explore the SWS fair ratio for China Resources Building Materials Technology Holdings
Result: Price-to-Earnings of 40.9x (OVERVALUED)
However, the weak 1 year and multi year shareholder returns, together with the company’s low value score of 2, could signal that execution or earnings quality disappointments may challenge the current valuation story.
Another view: Cash flows tell a different story
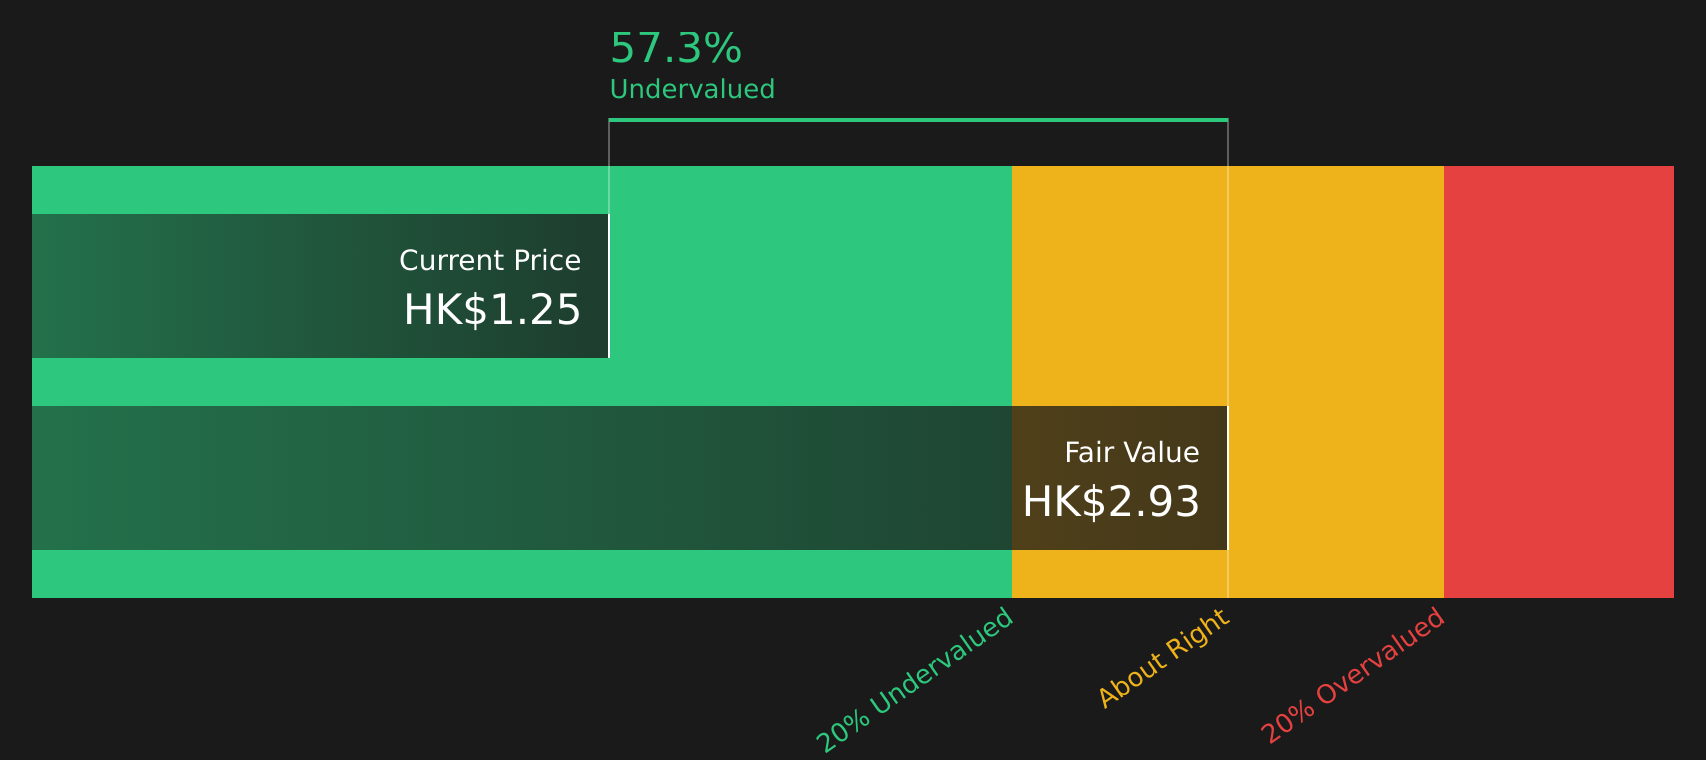
While the 40.9x P/E paints China Resources Building Materials Technology Holdings as expensive, the SWS DCF model suggests the opposite. At HK$1.25, the stock trades around 57.3% below an estimated future cash flow value of HK$2.93, which presents a very different narrative for you to weigh.
Look into how the SWS DCF model arrives at its fair value.

Simply Wall St performs a discounted cash flow (DCF) on every stock in the world every day (check out China Resources Building Materials Technology Holdings for example). We show the entire calculation in full. You can track the result in your watchlist or portfolio and be alerted when this changes, or use our stock screener to discover 209 high quality undervalued stocks. If you save a screener we even alert you when new companies match – so you never miss a potential opportunity.
Next Steps
Given the mixed signals around valuation, dividend and recent returns, it makes sense to review the numbers yourself and decide how the risk reward trade off stacks up for your portfolio using our breakdown of 2 key rewards and 3 important warning signs.
Looking for more investment ideas?
If this analysis has you thinking about what else might fit your watchlist, do not stop here. There are plenty of other stocks worth a closer look.
This article by Simply Wall St is general in nature. We provide commentary based on historical data
and analyst forecasts only using an unbiased methodology and our articles are not intended to be financial advice. It does not constitute a recommendation to buy or sell any stock, and does not take account of your objectives, or your
financial situation. We aim to bring you long-term focused analysis driven by fundamental data.
Note that our analysis may not factor in the latest price-sensitive company announcements or qualitative material.
Simply Wall St has no position in any stocks mentioned.
New: AI Stock Screener & Alerts
Our new AI Stock Screener scans the market every day to uncover opportunities.
• Dividend Powerhouses (3%+ Yield)
• Undervalued Small Caps with Insider Buying
• High growth Tech and AI Companies
Or build your own from over 50 metrics.
Have feedback on this article? Concerned about the content? Get in touch with us directly. Alternatively, email editorial-team@simplywallst.com