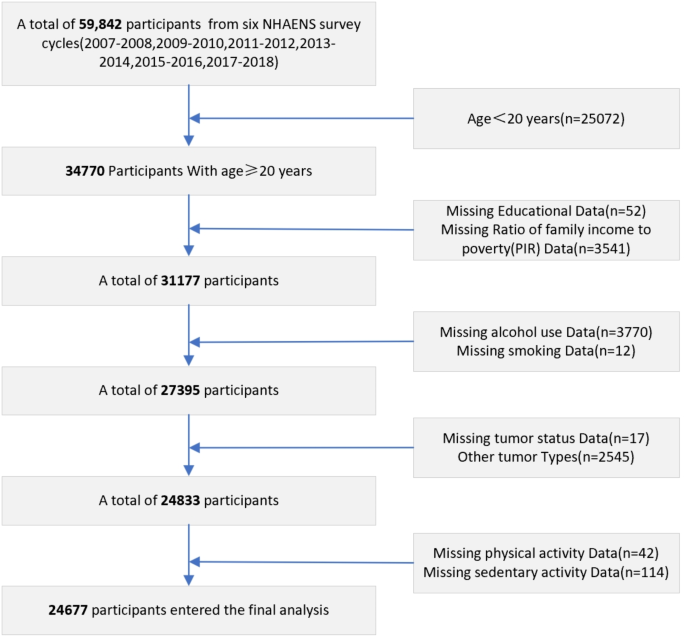
Inclusion and exclusion criteria for the study population
This study collected data from six survey cycles of NHANES from 2007 to 2018, with a total of 59,842 participants. Firstly, participants under the age of 20 were excluded, followed by those with missing covariates, exposure variables, and outcome variables. The detailed study population inclusion criteria are shown in Fig. 1, and ultimately 24,677 participants were included in the final analysis (Fig. 1).
Baseline characteristics
We calculated the MET of each participant based on the duration of different types of PA and their corresponding MET scores per day. Based on previous research, it is recommended to engage in moderate-intensity physical activity for at least 30 min or more per day15,16. We divided participants’ PA levels into four groups based on MET: low PA (PA ≤ 120MET/day), mild PA (120 < PA ≤ 600MET/day), moderate intensity PA (600 < PA ≤ 1200MET/day), and high-intensity PA (PA > 1200MET/day).
Table 1 presents the baseline characteristics of all participants in detail (Table 1), with a gender ratio of 24,677 participants (male: female 12200:12477) and an average age of 48.20 ± 17.30 years. Among the participants, 180 were colon cancer patients, and 24,497 participants had no history of cancer. The average age of the 180 patients with colon cancer was 69.39 ± 11.93 years old. The incidence rate of men was slightly higher than that of women: 94 (52.2%) vs. 86 (47.8%). Table 1 also shows the relationship between exposure variables and covariates and the incidence rate of colon cancer. The results show that the incidence rate of colon cancer is significantly related to age, race, physical activity, and smoking (all P < 0.001).
Association between PA and the risk of colon cancer incidence
We used multivariate logistic regression to investigate the association between PA and the incidence of colon cancer. To correct the possible impact of confounding factors on the results, we constructed three models and gradually adjusted the covariates involved. In Model 1, we did not add covariates for adjustment. In Model 2, we added social demographic factors such as age, gender, race/ethnicity, education, and household income for adjustment. Model 3 includes a comprehensive set of adjustments: age, gender, race/ethnicity, education, household income, sedentary time, smoking history, and drinking history. These adjustments corrected the potential impact of confounding factors on the results, further enhancing the reliability of the findings in this study.
After adjusting for potential confounding factors, the model demonstrated a negative correlation between PA levels and the risk of colon cancer. In the fully adjusted Model 3, compared with the overall data of the participants in this study, the OR of the low PA group was 1.224 (95% CI 1.031–1.453, P = 0.023), the OR of the mild PA group was 1.026 (95% CI 0.707–1.488, P = 0.894), the OR of the moderate intensity PA group was 0.798 (95% CI 0.506–1.258, P = 0.334), and the OR of the high-intensity PA group was 0.470 (95% CI 0.249–0.885, P = 0.022) (Fig. 2). After adjusting for all covariates, we found that the risk of colon cancer in the low PA group significantly increased by 22.4%. As physical activity increases, the risk of colon cancer gradually decreases. There was no significant difference in the risk of colon cancer in the mild PA group compared to the overall sample. The risk of colon cancer in the moderate-intensity PA group was significantly reduced by 20.2%, and in the high-intensity PA group, the risk of colon cancer was significantly reduced by 53.0%. To further evaluate the association between PA and the risk of colon cancer, we used RCS regression analysis to assess the relationship between MET and the risk of colon cancer. As shown in Fig. 3, there is a significant causal relationship (P-overall:<0.001) and a significant non-linear relationship (P-non-linear:<0.001) between MET and the risk of colon cancer. The result shows that as MET increases, the risk of colon cancer gradually decreases. However, at 1879 MET/day, the correlation curve shows a turning point, indicating that increasing physical activity within a certain range can reduce the risk of colon cancer (Fig. 3).

Multivariable logistic regression analyses of physical activity and risk of colon cancer incidence. Model 1: Non-adjusted. Model 2: adjusted for age, gender, race/ethnicity, education, and household income. Model 3: adjusted for age, gender, race/ethnicity, education, household income, sedentary time, smoking history, and drinking history.

RCS regression analysis the relationship between MET and the risk of colon cancer. Significant causal relationship (P-overall:<0.001) and a significant non-linear relationship (P-non-linear:<0.001) between MET and the risk of colon cancer. At 1879 MET/day, the correlation curve shows a turning point.
Subgroup analysis of the association between PA and the risk of colon cancer incidence
We conducted subgroup analyses for four different PA levels to evaluate the impact of physical activity on the risk of colon cancer across subgroups (Figs. 4, 5, 6, 7). Subsequently, interaction effect analysis was used to assess whether participant characteristics affected the association between physical activity (PA) and the risk of colon cancer. The results showed a significant interaction in the sedentary time subgroup (p = 0.043) (Figs. 4, 5, 6, 7). Although there was an interactive effect in the sedentary time subgroup, the risk of colon cancer incidence increased in all subgroups in the low PA group (Fig. 4). It decreased in all subgroups in the high-intensity PA group (Fig. 7). This once again indicates a stable association between PA and the risk of colon cancer.

Forest plots for subgroup analysis of the low PA group(PA ≤ 120MET/day).

Forest plots for subgroup analysis of the mild PA group(120< PA ≤ 600MET/day).

Forest plots for subgroup analysis of the moderate intensity PA group(600 < PA ≤ 1200MET/day).

Forest plots for subgroup analysis of the high-intensity PA group(PA>1200MET/day).

