Key Highlights
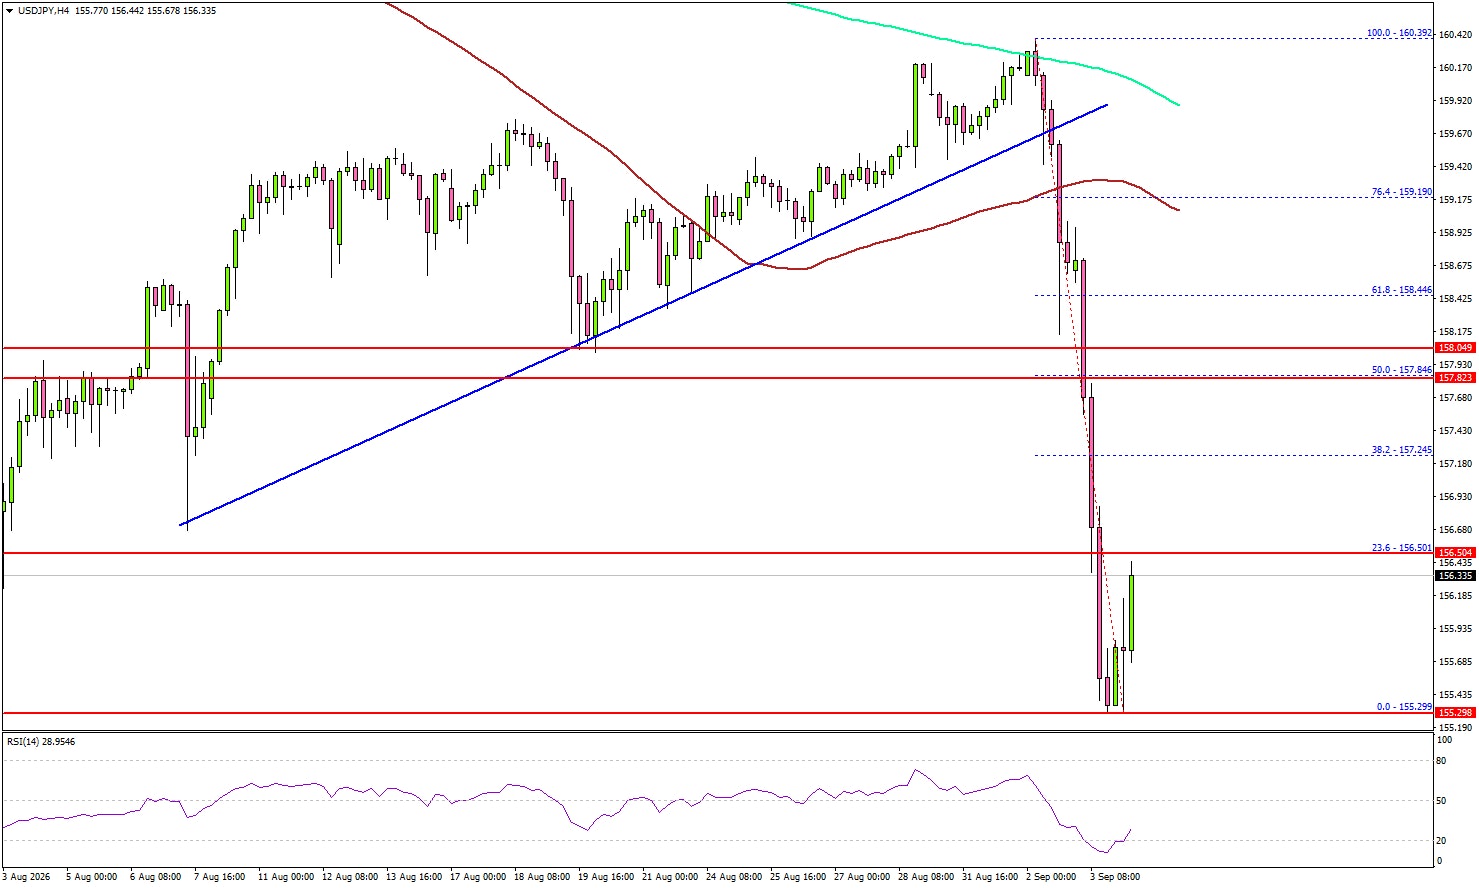
- USD/JPY started a major decline from the 160.40 zone.
- It traded below a key bullish trend line with support at 159.70 on the 4-hour chart.
- WTI Crude Oil prices could gain bullish momentum if it surpasses $92.65.
- EUR/USD is showing positive signs above the 1.1580 support.
USD/JPY Technical Analysis
The US Dollar struggled to stay above 160.00 against the Japanese Yen. USD/JPY traded below 159.50 and 158.80 to enter a bearish zone.
Looking at the 4-hour chart, the pair traded below a key bullish trend line with support at 159.70. The bearish momentum gained strength after there was a close below 158.00, the 100 simple moving average (red, 4-hour), and the 200 simple moving average (green, 4-hour).
The pair even tested the 155.25 support zone. A low was formed at 155.29, and it is now consolidating losses. On the upside, it could face resistance near the 23.6% Fib retracement level of the downward move from the 160.39 swing high to the 155.29 low at 156.50.
The next major resistance might be 157.25. A close above 157.25 could start another steady increase. In the stated case, the bulls could aim for a move to 157.85 and the 50% Fib retracement level.
If there is another decline, the pair might find bids near 155.65. The first major support could be near 155.25. A downside break and close below 155.25 might start a major leg down. In the stated case, the bears could aim for a move to 154.40.
Looking at WTI Crude Oil prices, the price gained bullish pace, and the bulls could now aim for a move toward the $95.00 level.
Upcoming Key Economic Events:
- US nonfarm payrolls for August 2026 – Forecast 56K, versus -23K previous.
- US Unemployment Rate for August 2026 – Forecast 4.1%, versus 4.1% previous.