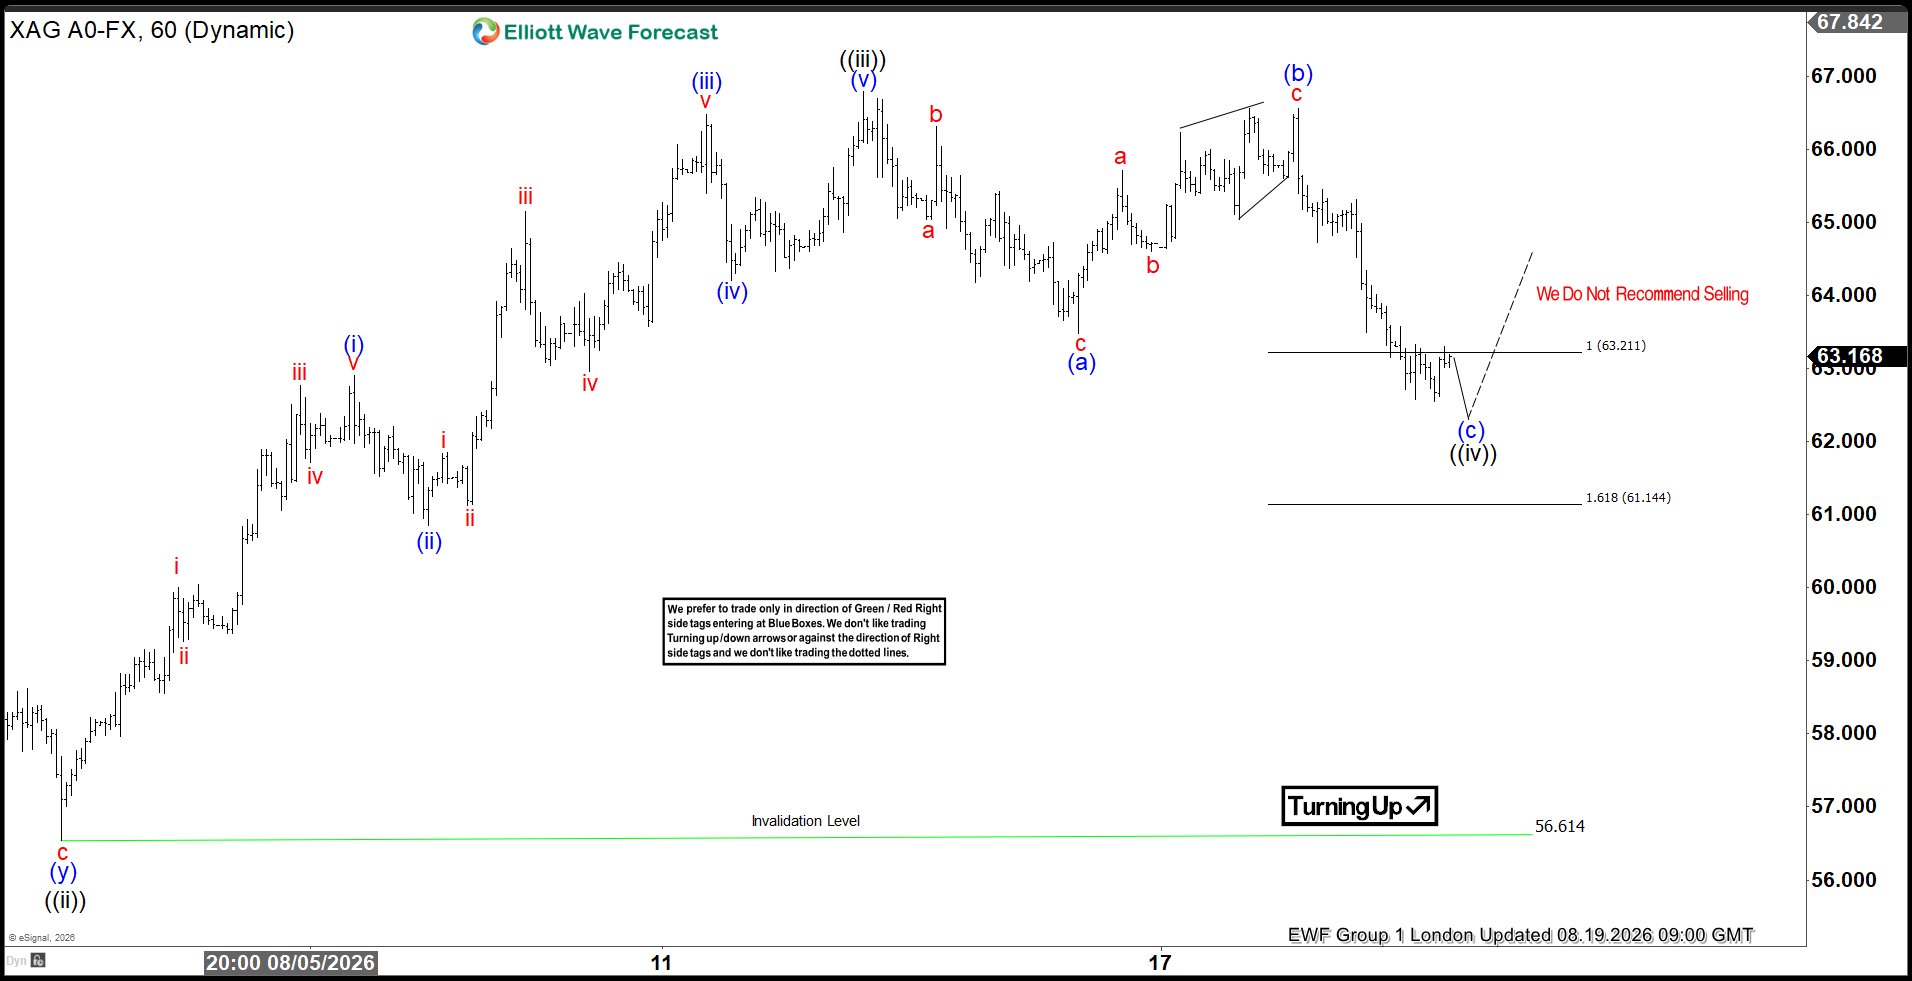
Hello Traders, in today’s blog we’re reviewing the $XAGUSD wave count shared with members, which highlighted a strong bullish outlook. The Elliott Wave pattern confirmed the move right at the extreme/high‑frequency zone, propelling prices sharply higher.
XAGUSD After Completing Major Correction from All‑Time Highs
Silver peaked earlier this year at 121.503 on January 29, 2026, before entering a six‑month corrective phase that concluded at 3940.68 on July 17, 2026. From that low, Silver rallied to complete wave (4) at 62.548, then turned higher, finishing wave 1 of a new nest. Price has since pulled back in a proposed wave 2, holding against the 62.548 pivot.
The Forecast: Completion of Wave ((iv)) Correction
The setup identified Silver at a decisive turning point following a corrective pullback from the peak near $67.84. After completing a multi‑wave bullish impulse into wave ((iii))/(v) above $67.00, price action unfolded into a corrective three‑wave (a)‑(b)‑(c) decline, designated as sub‑wave ((iv)).
The projected target zone for wave (c) of ((iv)) was between the 100% Fibonacci expansion at 63.211 and the 161.8% expansion at 61.144. The trade bias was clearly defined as “Turning Up”, with the explicit warning: “We Do Not Recommend Selling.” Traders were instructed to wait for the corrective wave to terminate within or near the target zone before initiating long positions.
The invalidation level was set at 56.614 (wave ((ii)) low), where a break below would negate the bullish structure. See below chart
The After Analysis
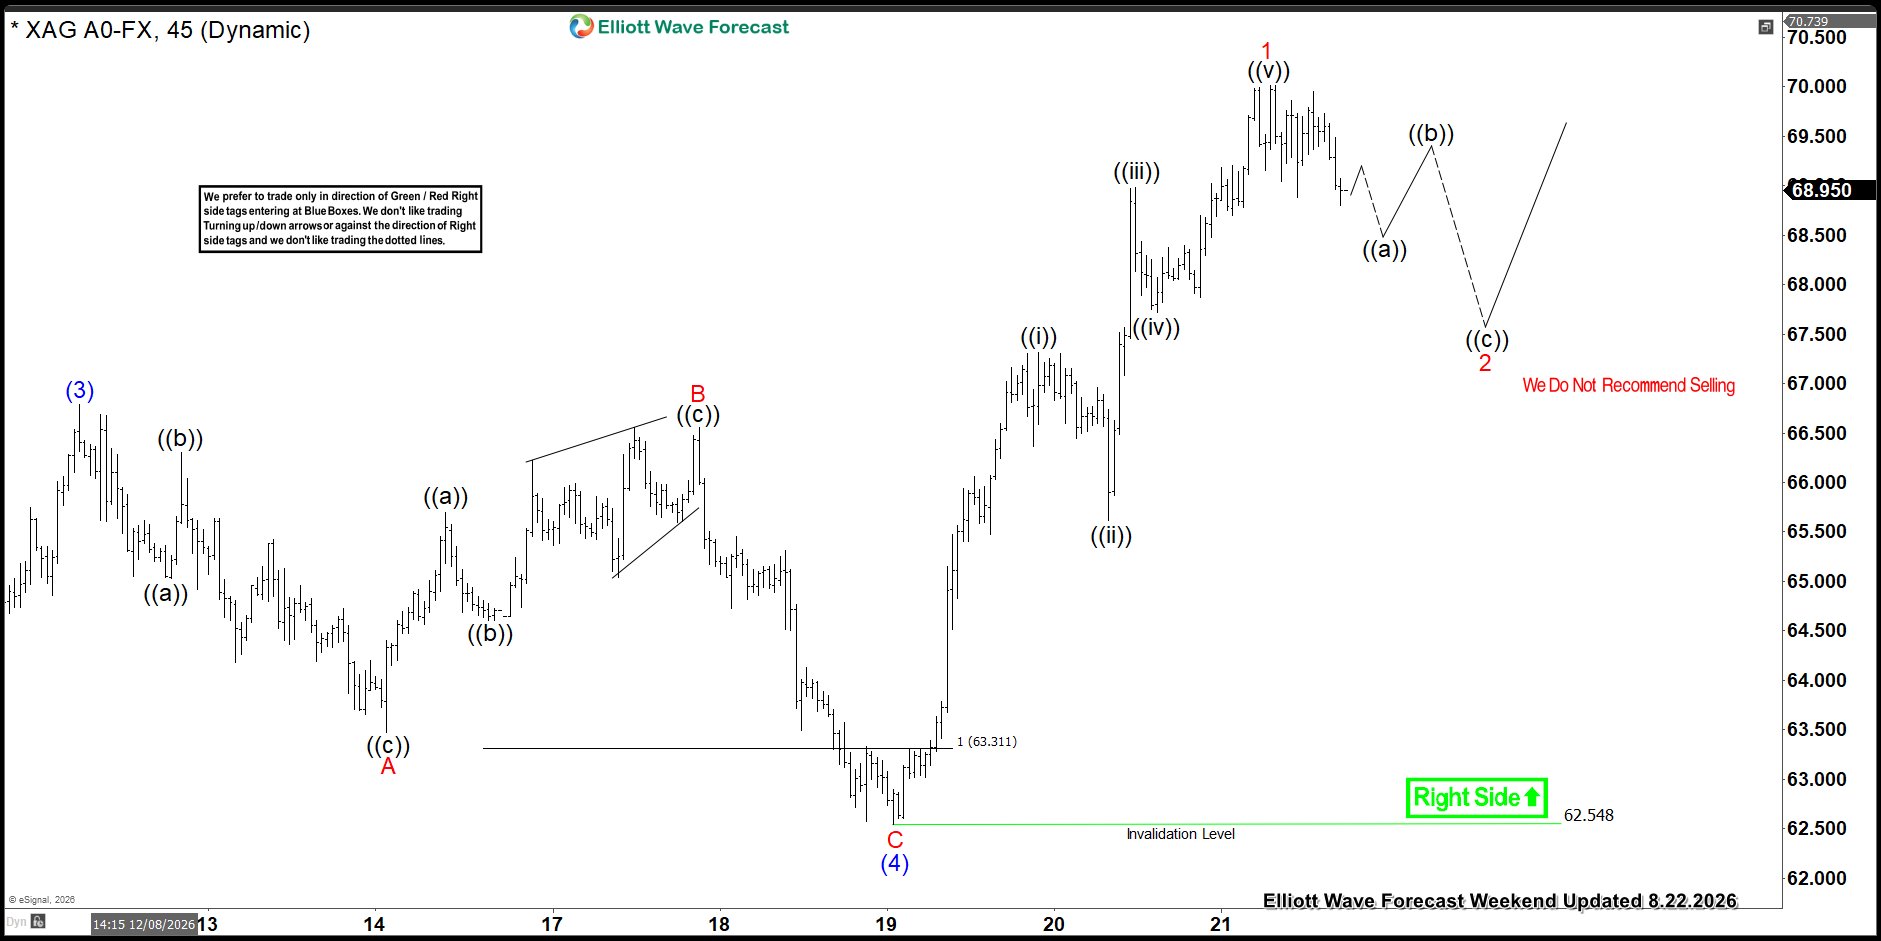
The follow‑up chart confirms that the wave projection unfolded almost exactly as anticipated (Note: We had some degree adjustments). Wave C of (4) completed squarely within the target zone, bottoming at 62.548—just above the updated invalidation level—before buyers stepped in aggressively.
From the 62.548 floor, Silver launched into a clean 5‑wave micro‑impulse, driving price through $70.00 and topping at 70.739. With Wave 1 complete at 70.739, the market is now undergoing a minor corrective consolidation in Wave 2, proposed as a three‑swing structure, setting the stage for the next upside leg. See chart below
Comparative Setup Overview
Between the August 19 “Before” forecast and the August 22 “After” execution, the market transitioned from the tail end of a Wave ((iv)) correction into a fully completed Wave 1 impulse. The initial setup targeted an entry zone between 63.211 and 61.144, which ultimately bottomed cleanly at 62.548.
As the primary trend resumed, the invalidation level was raised from 56.614 to 62.548 to lock in profit protection. The resulting rally drove price to a peak of 70.739, marking a +$8.19 / +13.1% rebound and fully validating the “Right Side” bullish bias.
What’s Next for Silver in the Coming Weeks?
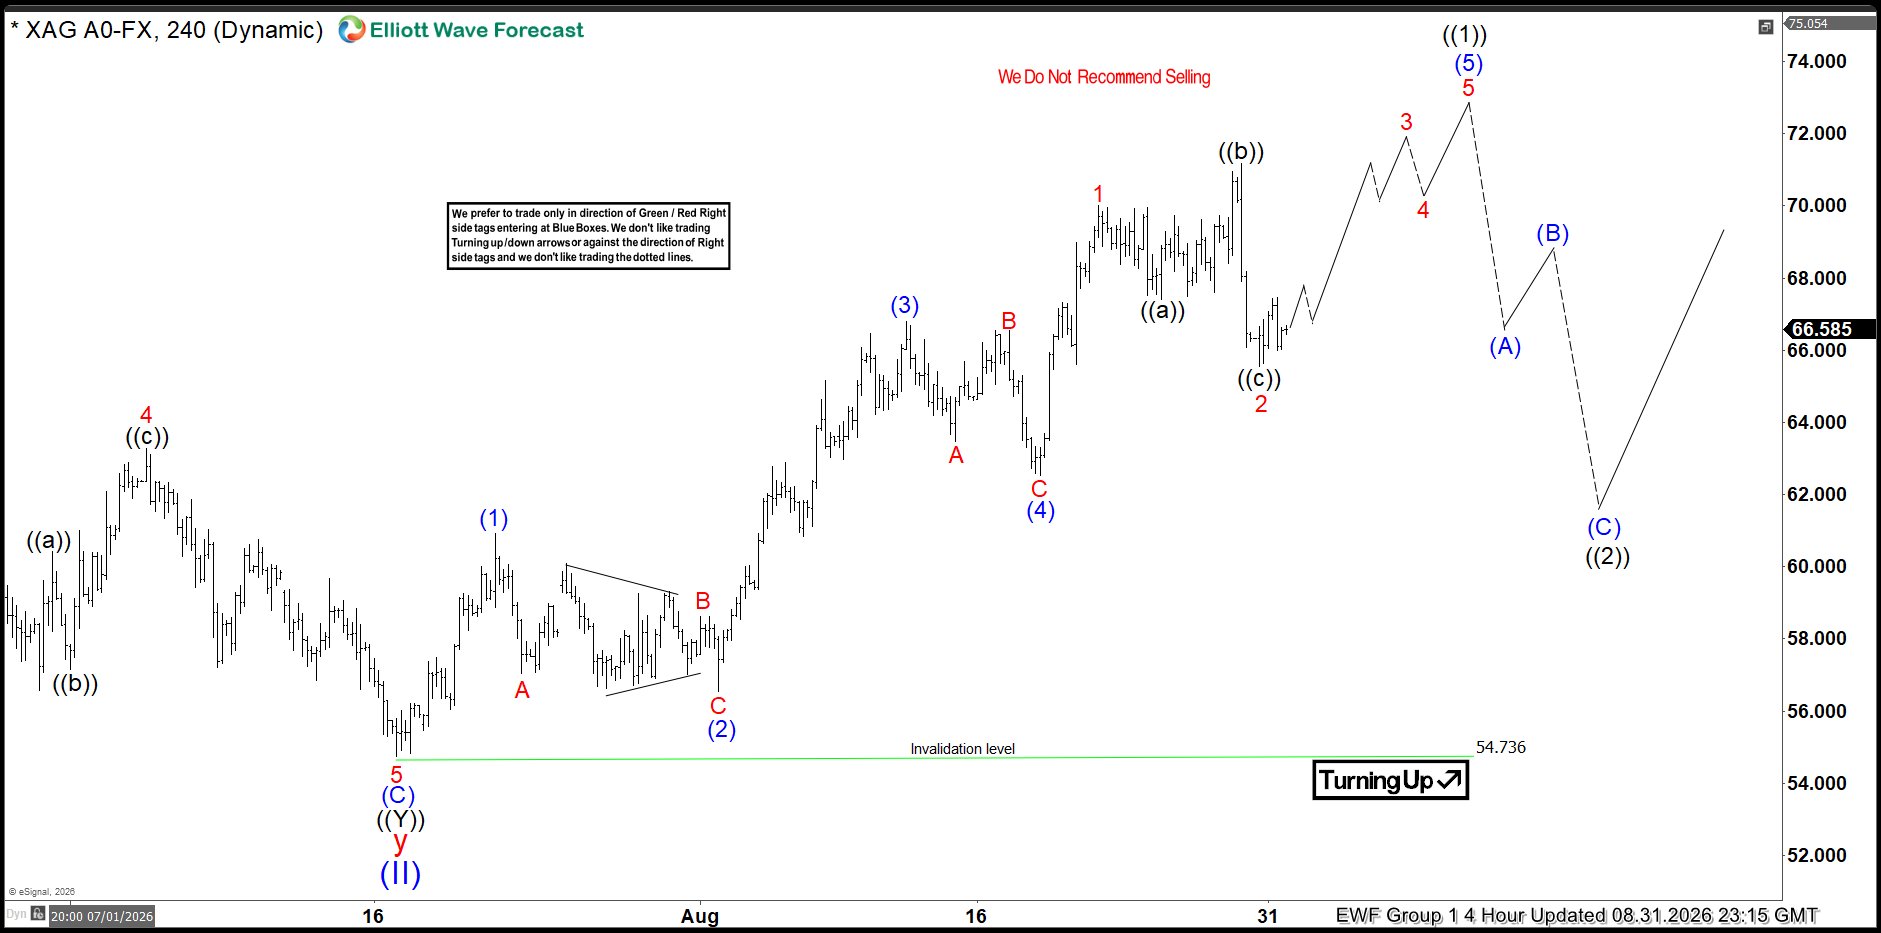
As charts progress, the structures and labeling naturally evolve. At the time of writing, wave 2 is proposed to have ended as a flat correction and is now turning higher, with the invalidation level maintained at 62.548. As long as price holds above this pivot, Silver is expected to continue advancing to eventually complete wave (5) of higher degree within wave ((1)). From there, the market would be positioned for a corrective pullback in wave ((2)) against the July lows, before resuming the broader bullish cycle. See chart below
Why choose EWF ?
At Elliottwave Forecast (EWF), we deliver consistent market updates through regular charts update. Our analysts update 1‑hour charts four times daily and 4‑hour charts once per day across all 78 instruments. In addition, we host five live sessions each day and maintain a 24‑hour chatroom, providing clients with real‑time market guidance and answers to any questions they may have.
You can start a 14‑day trial with us today here and cancel anytime by emailing support@elliottwave-forecast.com
Follow on X @NgcoboGen