Quick overview
- Tesla’s stock (TSLA) dropped 12.68% to $323.40 after reporting Q2 2026 results that beat revenue expectations but missed on profitability metrics.
- The company reported revenue of $28.24 billion but a non-GAAP EPS of $0.33, missing estimates by 39%, while operating income fell 57% year-on-year.
- Free cash flow turned negative at $1.09 billion, driven by a significant increase in capital expenditures and a collapse in regulatory credit income.
- Musk’s pivot towards AI and autonomous vehicles is generating negative cash flow, raising concerns about the timeline for future profitability.
TSLA is trading at $323.40 on July 23, down 12.68%, after reporting Q2 2026 results that beat on revenue but delivered one of the worst profitability quarters in recent memory. Revenue of $28.24 billion beat estimates. Non-GAAP EPS of $0.33 missed the $0.53 consensus by 39%. Operating income collapsed 57% year-on-year.
Free cash flow turned negative. The market is answering a simple question: at 349x earnings, how much profitability destruction can the AI bet absorb?
The Numbers Behind the 12.68% Drop
Tesla beat revenue expectations at $28.24 billion versus $26.71 billion estimated, but non-GAAP EPS of $0.33 missed projections by 39.1%. The miss is not a rounding error. It is a structural gap driven by four simultaneous headwinds hitting in the same quarter.
Operating income collapsed 57% year-on-year to $398 million, producing an operating margin of just 1.4% compared with 4.1% in Q2 2025. The primary drivers were a 47% increase in operating expenses driven by AI infrastructure and robotics R&D, and a 67% collapse in regulatory credit income from $439 million to $146 million, a revenue stream Tesla has relied on for years that is now effectively gone. Free cash flow turned negative at $1.09 billion as capital expenditure rose 142% year-on-year to $5.79 billion.
Automotive gross margin slid to 16.8% from 17.2% a year earlier, against analyst expectations of 19.4%. The miss on margin, the miss on EPS, and the miss on free cash flow all arriving in the same quarter creates a trifecta of bearish data points that a 349x earnings multiple cannot absorb without a significant derating.
Three things investors needed to see that did not materialise: margin stabilisation above 17%, regulatory credits above $300 million, and positive free cash flow. Tesla delivered none of them.
What Musk Is Actually Building and Why the Market Is Not Paying For It Yet
Musk has shifted the company’s focus away from vehicle sales toward its driverless Robotaxi service, ramping Cybercab production and remaking Fremont factory lines to manufacture Optimus humanoid robots. The $5.79 billion Q2 capex, up 142% year-on-year, is the financial expression of that pivot.
The Robotaxi pilot in Austin continues with a limited fleet of autonomous Model Y vehicles. The Cybercab, priced at $30,000 and targeting a 2026 launch, remains the product that justifies the current valuation, but no commercial revenue date has been confirmed. Optimus remains pre-revenue.
The bull case is intact as a long-term thesis. The problem is the timeline: Musk is spending at a rate that generates negative free cash flow today, with no confirmed date for when Robotaxi and Optimus revenues begin offsetting that spend. At 349x earnings with a 1.4% operating margin, the market is not patient enough to wait indefinitely.
TSLA Technical Analysis: RSI at 19, Deeply Oversold but Downtrend Intact
TSLA has broken below all near-term support levels, sitting well below the 50-period EMA at $379.31 and the 200-period EMA at $395.53. The stock is testing the 0% Fibonacci retracement at $316.47, the last structural support before $299.
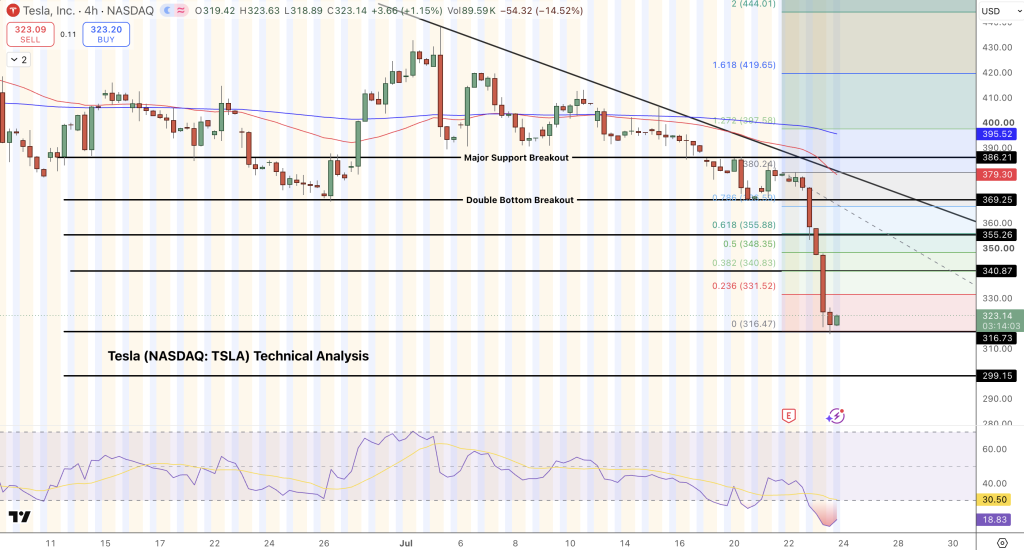
Resistance: $331.52 (immediate), then $340.87, then $348.35, the level that must be reclaimed before any recovery is credible. Support: $316.47 (0% Fibonacci, must hold), then $299.15 (next major downside target).
RSI at 19.1 is deeply oversold, one of the lowest readings TSLA has registered since 2022. Oversold conditions increase the probability of a technical bounce but do not reverse a fundamental derating. The pattern here is classic: gap down, oversold bounce to first resistance at $331.52, then sellers reassert if no new fundamental catalyst emerges.
Trade setup for technical bounce: Long above $331.52, target $340.87, stop below $316.47. For bears: Short below $316.47 confirmed daily close, target $299.15, stop above $331.52.
FAQ: TSLA, 39% EPS Miss, Free Cash Flow, and Whether $316 Holds
Why did Tesla miss EPS by 39% when deliveries beat expectations?
Deliveries measure volume; EPS measures profitability. The 47% increase in operating expenses driven by AI infrastructure and robotics R&D, combined with a 67% collapse in regulatory credit income and a 142% capex increase, destroyed the earnings that delivery volume would otherwise have generated.
Tesla is deliberately trading current profitability for future AI and autonomy capability. At 349x earnings, the market is no longer willing to give unlimited credit for that trade.
What does negative free cash flow mean for Tesla?
Tesla generated $1.44 billion in free cash flow in Q1 2026 and $146 million in Q2 2025. Turning negative at $1.09 billion in Q2 2026 means the company spent more cash than it generated for the first time in several quarters. Tesla holds $37 billion in cash and investments, so this is not a liquidity crisis.
It does confirm that the Cybercab and Optimus investment programmes are now absorbing Tesla’s automotive cash generation entirely. The question investors are asking: how many more quarters of negative free cash flow before the Robotaxi revenues offset it?
Is $316 a floor or will TSLA fall to $299?
Tesla is technically oversold with RSI at 19.1, having breached the $369.25 support level. The $316.47 Fibonacci retracement is the last line between the current correction and a move toward $299. A confirmed daily close below $316, particularly if accompanied by volume, would extend the decline toward $299 and potentially lower.
A hold above $316 with an oversold RSI bounce could target $331 to $340 in a relief rally. The fundamental picture, specifically the 1.4% operating margin, negative FCF, and no Robotaxi commercial date, means any bounce is likely to be a selling opportunity until at least one of those three changes.

Arslan Ali Butt
Lead Markets Analyst – Multi-Asset (FX, Commodities, Crypto)
Arslan Ali Butt serves as the Lead Commodities and Indices Analyst, bringing a wealth of expertise to the field. With an MBA in Behavioral Finance and active progress towards a Ph.D., Arslan possesses a deep understanding of market dynamics.
His professional journey includes a significant role as a senior analyst at a leading brokerage firm, complementing his extensive experience as a market analyst and day trader. Adept in educating others, Arslan has a commendable track record as an instructor and public speaker.
His incisive analyses, particularly within the realms of cryptocurrency and forex markets, are showcased across esteemed financial publications such as ForexCrunch, InsideBitcoins, and EconomyWatch, solidifying his reputation in the financial community.