As global markets navigate a complex landscape of monetary policy shifts and geopolitical developments, Asian equities have shown resilience amid mixed economic signals. With Japan’s stock markets surging to new heights and China grappling with uneven recovery, investors are keenly observing opportunities for undervalued stocks that might offer significant upside potential. Identifying stocks trading below their intrinsic value can be particularly appealing in such uncertain times, as these investments may provide a margin of safety while capitalizing on broader market trends.
Top 10 Undervalued Stocks Based On Cash Flows In Asia
| Name | Current Price | Fair Value (Est) | Discount (Est) |
| TRIAL Holdings (TSE:141A) | ¥2793.00 | ¥5447.61 | 48.7% |
| Taiwan Union Technology (TPEX:6274) | NT$1720.00 | NT$3344.56 | 48.6% |
| Rayhoo Motor DiesLtd (SZSE:002997) | CN¥30.01 | CN¥59.00 | 49.1% |
| Pegasus (TSE:6262) | ¥516.00 | ¥1003.43 | 48.6% |
| Moshi Moshi Retail Corporation (SET:MOSHI) | THB36.50 | THB70.95 | 48.6% |
| Mao Geping Cosmetics (SEHK:1318) | HK$52.45 | HK$103.86 | 49.5% |
| Korea Circuit (KOSE:A007810) | ₩99900.00 | ₩198067.58 | 49.6% |
| Innovent Biologics (SEHK:1801) | HK$76.50 | HK$148.71 | 48.6% |
| Innodisk (TPEX:5289) | NT$1885.00 | NT$3710.80 | 49.2% |
| DIO (KOSDAQ:A039840) | ₩12740.00 | ₩25033.18 | 49.1% |
Let’s take a closer look at a couple of our picks from the screened companies.
Overview: MicroTech Medical (Hangzhou) Co., Ltd. specializes in providing diabetes management, treatment, and monitoring medical devices both in China and internationally, with a market cap of HK$2.99 billion.
Operations: The company’s revenue segment is focused on the research and development, manufacture, and sales of medical devices, generating CN¥660.79 million.
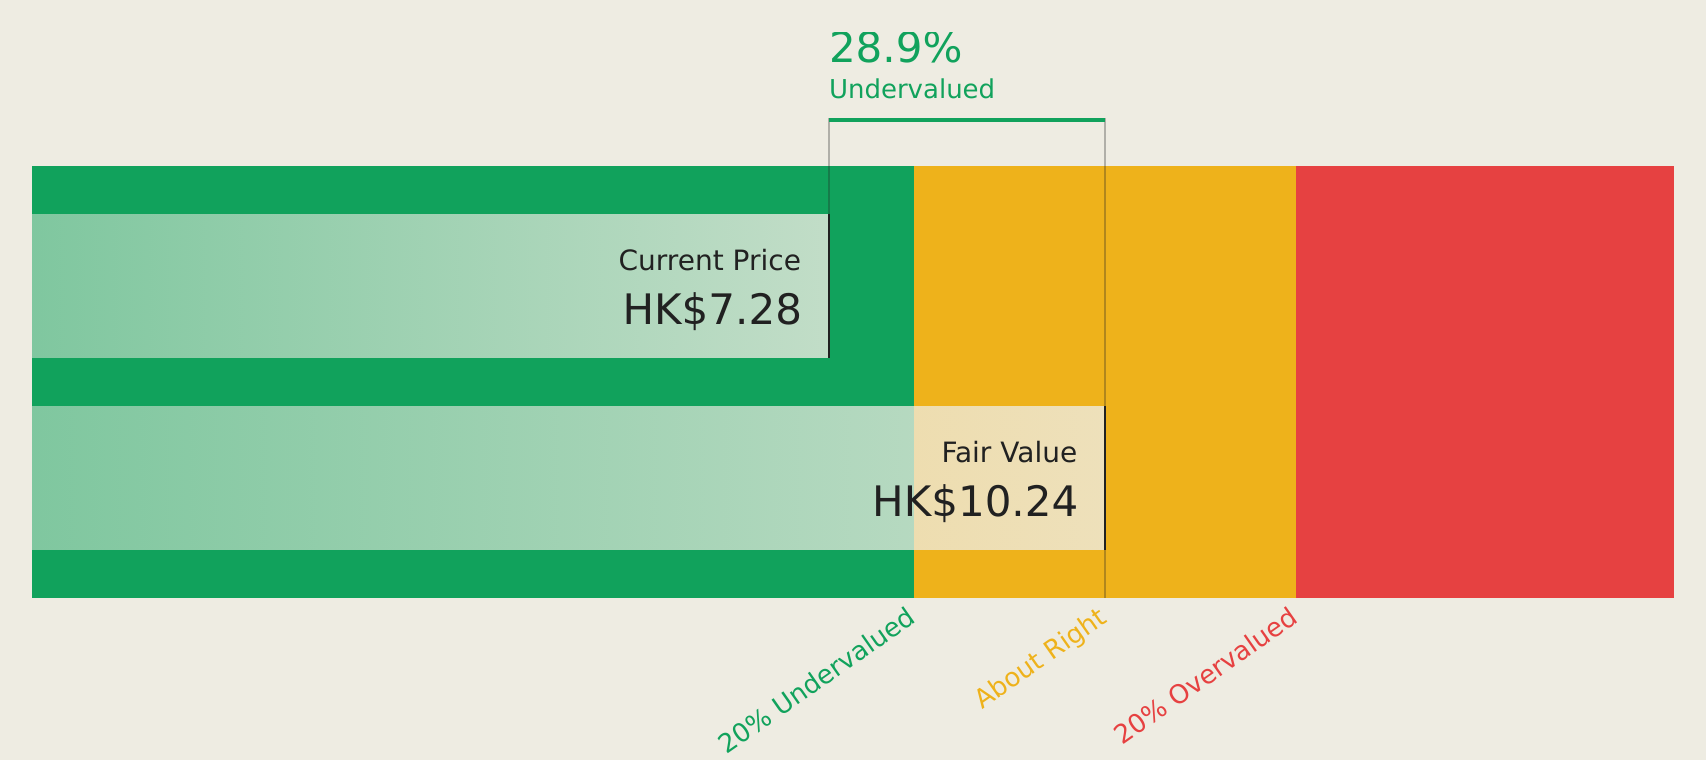
Estimated Discount To Fair Value: 28.9%
MicroTech Medical (Hangzhou) is trading at HK$7.28, below its estimated future cash flow value of HK$10.24, indicating undervaluation based on discounted cash flows. The company has become profitable this year with net income reaching CNY 40.15 million from a previous loss, and earnings are forecast to grow significantly at 44.9% annually over the next three years, outpacing the Hong Kong market’s growth rate of 12.9%.
Overview: Zhejiang Meili High Technology Co., Ltd. is involved in the research, development, production, and sale of high-end spring products both in China and internationally, with a market cap of CN¥5.37 billion.
Operations: Zhejiang Meili High Technology Co., Ltd. generates revenue through its involvement in the research, development, production, and sale of high-end spring products across domestic and international markets.
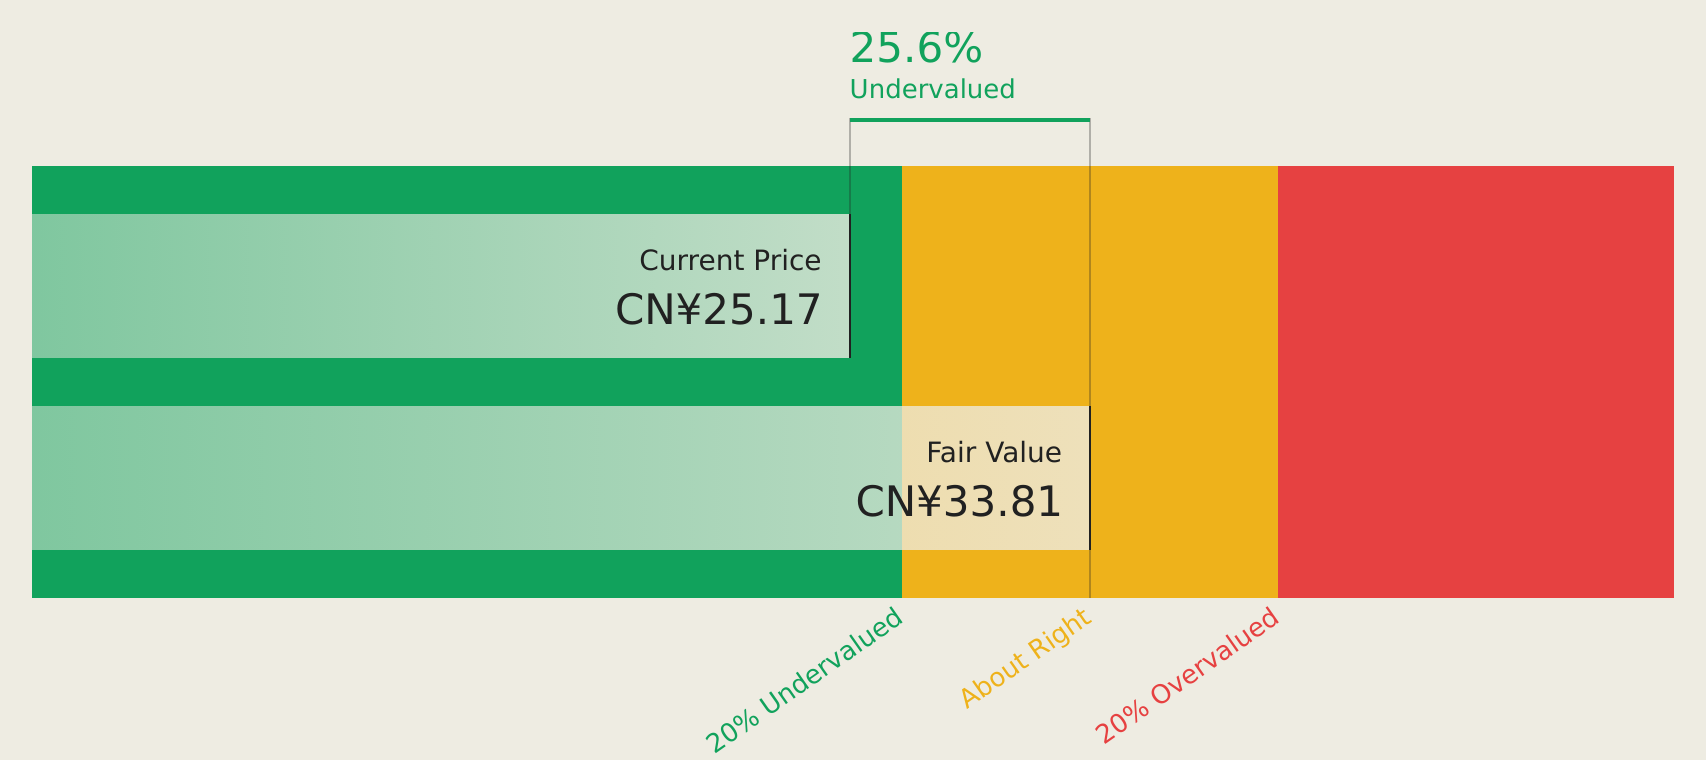
Estimated Discount To Fair Value: 22.1%
Zhejiang Meili High Technology is trading at CN¥26.07, below its estimated cash flow value of CN¥33.47, highlighting potential undervaluation based on discounted cash flows. Despite a recent dip in quarterly net income to CN¥17.32 million, the company forecasts strong revenue growth of 28.7% annually and earnings growth of 32.1%, surpassing market averages. A share buyback program worth up to CNY 70 million further underscores management’s confidence in its financial position and future prospects.
Overview: baudroie,inc. offers optimal IT solutions in Japan and has a market cap of ¥81.05 billion.
Operations: The company’s revenue segments include providing optimal IT solutions in Japan.
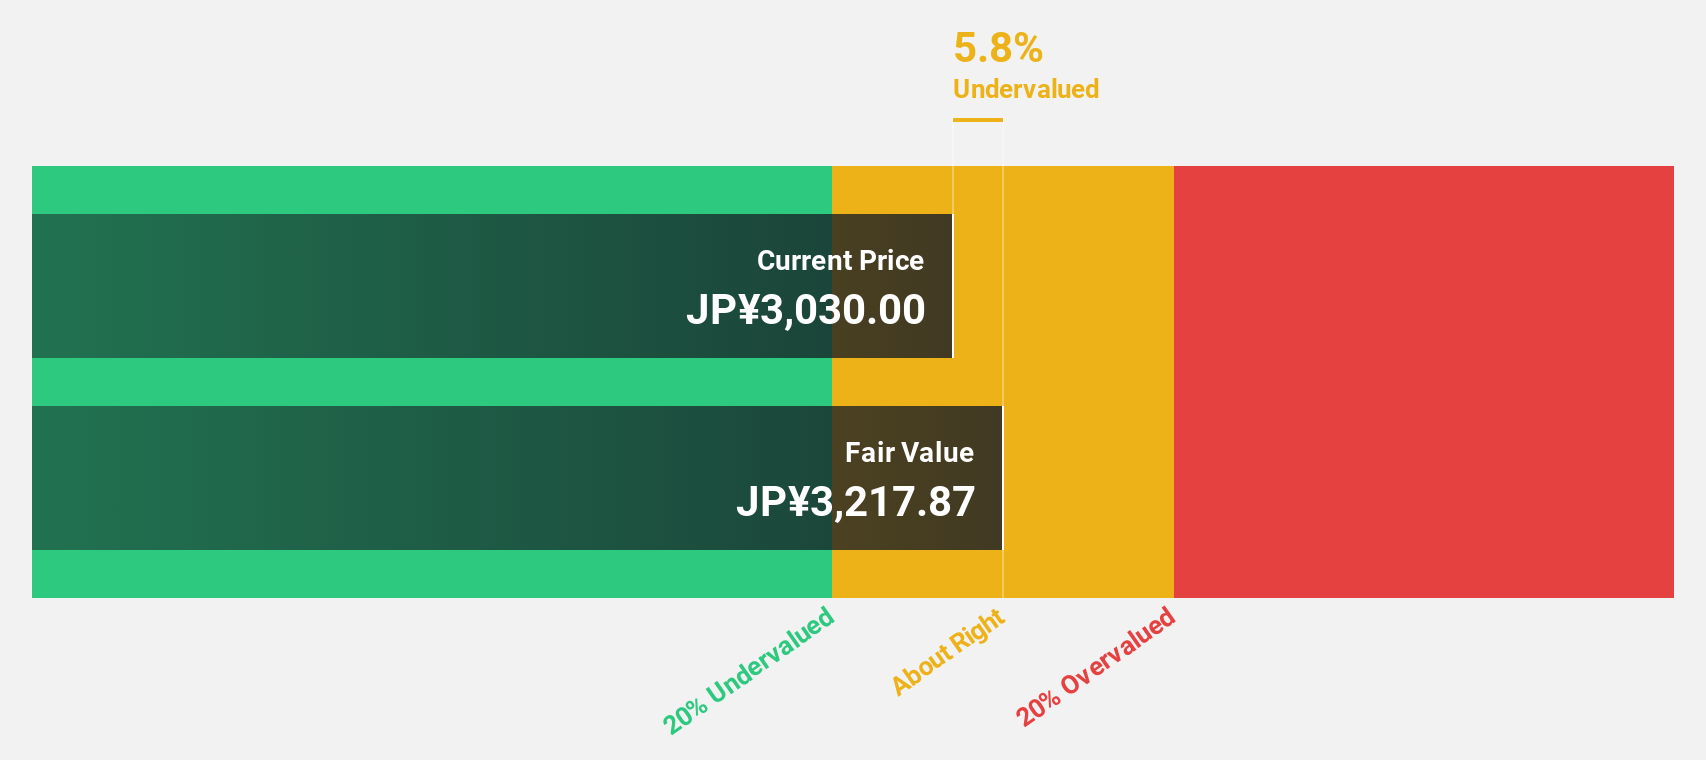
Estimated Discount To Fair Value: 14.6%
Baudroie, Inc. trades at ¥2,438, below its estimated cash flow value of ¥2,854.3, suggesting potential undervaluation. Recent earnings showed net income growth to ¥2.46 billion from ¥1.8 billion last year and a forecasted revenue increase to ¥23.5 billion for the next fiscal year indicates robust financial health and growth prospects. Despite high share price volatility recently, the company’s strong profit trajectory and increased dividend proposal reflect positive future expectations.
Where To Now?
Ready To Venture Into Other Investment Styles?
This article by Simply Wall St is general in nature. We provide commentary based on historical data
and analyst forecasts only using an unbiased methodology and our articles are not intended to be financial advice.
It does not constitute a recommendation to buy or sell any stock, and does not take account of your objectives, or your
financial situation. We aim to bring you long-term focused analysis driven by fundamental data.
Note that our analysis may not factor in the latest price-sensitive company announcements or qualitative material.
Simply Wall St has no position in any stocks mentioned.
New: Manage All Your Stock Portfolios in One Place
We’ve created the ultimate portfolio companion for stock investors, and it’s free.
• Connect an unlimited number of Portfolios and see your total in one currency
• Be alerted to new Warning Signs or Risks via email or mobile
• Track the Fair Value of your stocks
Have feedback on this article? Concerned about the content? Get in touch with us directly. Alternatively, email editorial-team@simplywallst.com