Key Highlights
- USD/JPY seems to be struggling to clear the 159.65 resistance.
- It traded below a bullish trend line with support at 159.40 on the 4-hour chart.
- EUR/USD is still struggling to clear the 1.1675 resistance zone.
- Gold corrected some losses and tested the $4,525 resistance.
USD/JPY Technical Analysis
The US Dollar climbed above 158.50 and 158.80 against the Japanese Yen. USD/JPY even surpassed 159.20 before the bears appeared.
Looking at the 4-hour chart, the pair settled above the 158.50 level, the 100 simple moving average (red, 4-hour), and the 200 simple moving average (green, 4-hour). However, it faced resistance near the 159.65 zone.
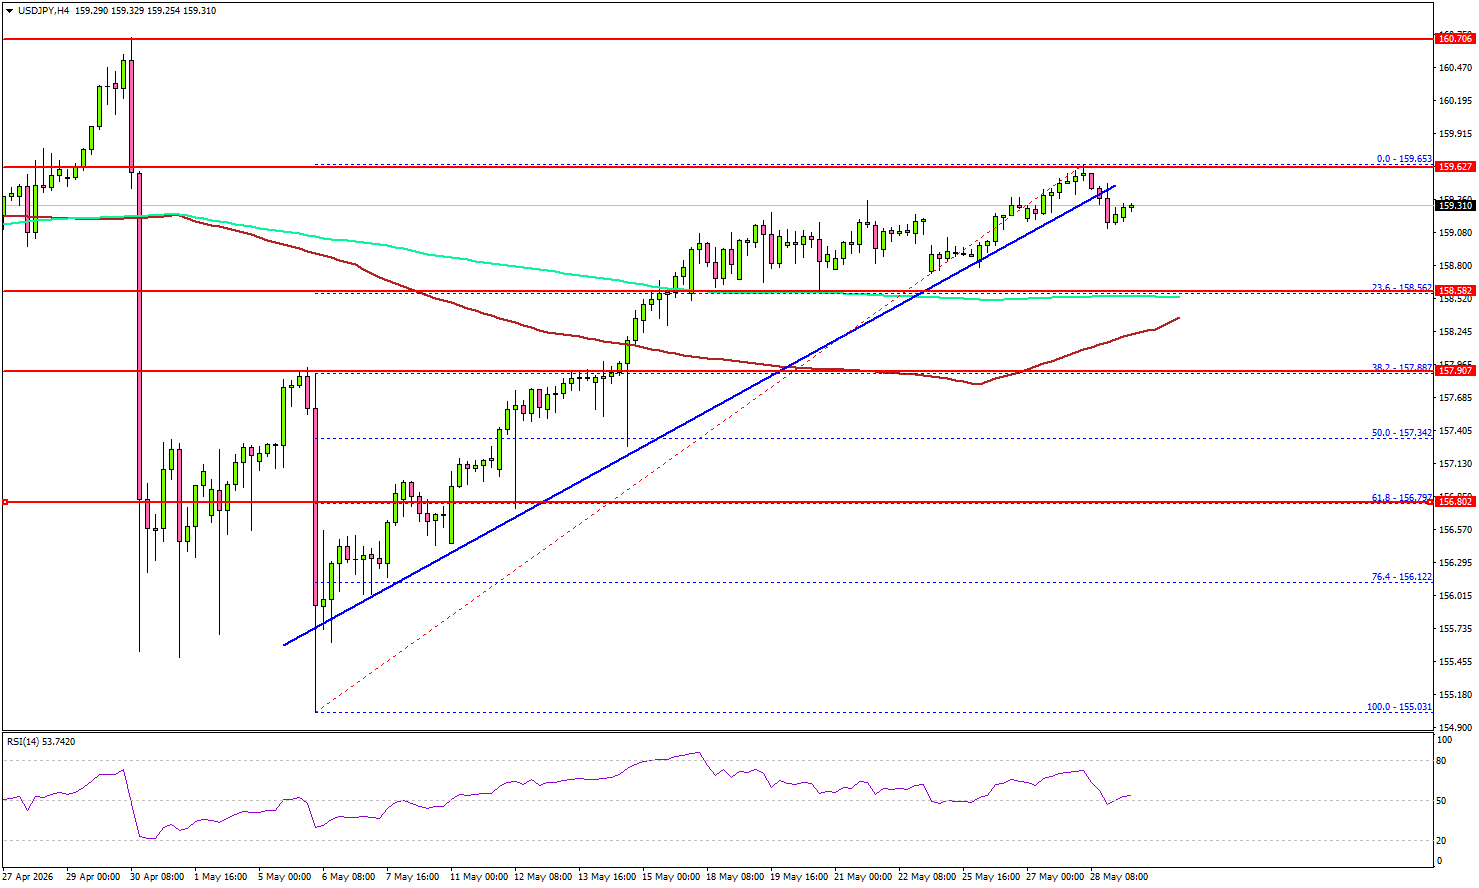
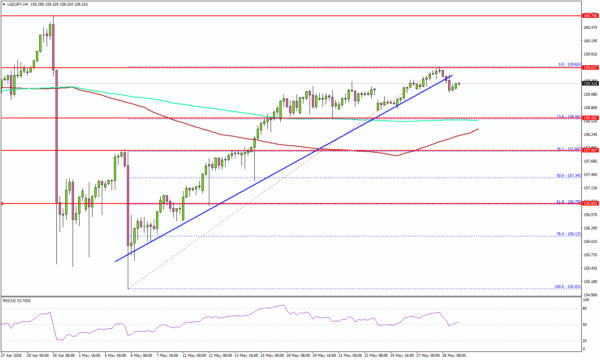
A high was formed at 159.65, and the pair is now correcting some gains. There was a move below a bullish trend line with support at 159.40. If the pair extends losses, it could test the 23.6% Fib retracement level of the upward move from the 155.03 swing low to the 159.65 high.
The first major support sits near the 158.50 level and the 100 simple moving average (red, 4-hour). The next support could be 157.85. A close below 157.85 might initiate a drop to the 61.8% Fib retracement level of the upward move from the 155.03 swing low to the 159.65 high at 156.80.
Any more losses might open the doors for a drop toward the 156.00 zone. On the upside, the pair could face resistance at 159.65. The next major resistance could be 160.00. A close above 160.00 could open doors for gains above 160.50. In the stated case, the bulls could aim for a move to 162.00.
Looking at EUR/USD, the pair is attempting to recover some losses, but it faces a major hurdle near the 1.1675 region.
Upcoming Key Economic Events:
- Fed’s Bowman speech.
- Fed’s Paulson speech.
- Chicago PMI for May 2026 – Forecast 49.7, versus 49.2 previous.