It’s time to revisit what the oil futures market is pricing in. The data make for fascinating reading and, arguably, positive news for investors in energy stocks such as Chevron (NYSE: CVX) and U.S.-focused energy infrastructure ETFs like the Global X MLP & Energy Infrastructure ETF (NYSEMKT: MLPX). Here’s what it all means to investors.
Interpreting the oil futures data
In theory, at least, futures prices should trade in “contango,” meaning that prices further out trade higher than near-term prices. This reflects the cost of storage, insurance, and cash tied up in holding it.
Will AI create the world’s first trillionaire? Our team just released a report on the one little-known company, called an “Indispensable Monopoly” providing the critical technology Nvidia and Intel both need. Continue »
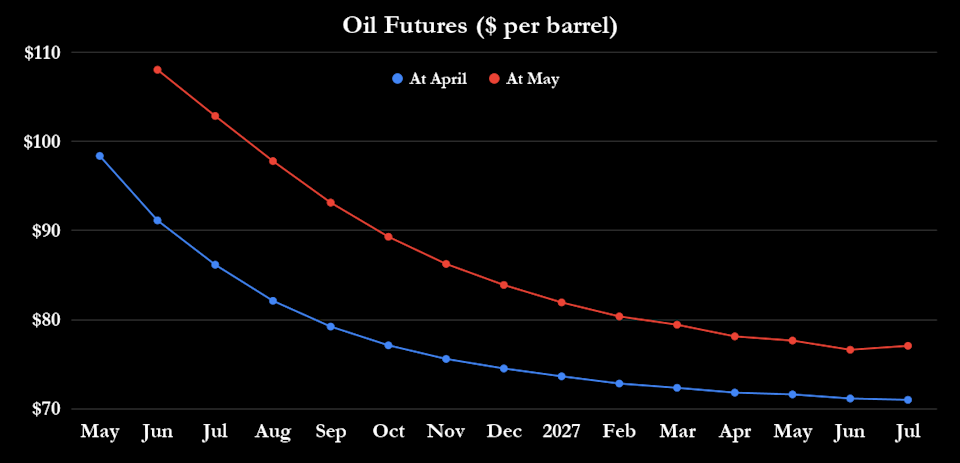
However, in practice, oil futures often trade in backwardation (as in the chart), whereby nearer-term prices are higher than longer-term prices. This is possibly due to a concerted preference to avoid the risk of a future price rise due to OPEC action or geopolitical factors by having oil to hand in the near term.
Backwardation also occurs when a scarcity of near-term supply stresses the oil market, but it is expected to normalize over time. That’s pretty much what the chart says. You could think of it as the market signaling it’s pricing in a near-term supply constraint that will normalize over time.
There are two things in the chart that imply that futures contracts are shown as being higher in early April than in mid-May:
-
Both sets of data show backwardation with lower prices in the future.
-
Note that the spread between the May and April series data is much larger earlier (for example, in June, July, and August 2026) than it is later (for example, in May, June, and July 2027); this implies the increase in the spot price of oil between April and May is being absorbed by the front end of the curve.
All told, the oil futures market is still implying that the conflict will be resolved and the disruption to oil supplies will prove temporary. Given the difficulties inherent in ramping up near-term oil production, changing demand patterns, and/or shifting to substitutes, this view also implies a reopening of the Strait of Hormuz.
For reference, the International Energy Agency estimates that 34% of global crude oil trade passed through the Strait in 2025. Traffic through the Strait is essential to the global oil industry.
What oil companies are doing
If you extrapolate this conclusion to the equity markets, you could argue that they are pricing in a near-term profitability scenario for oil stocks, with normalization thereafter. It’s a scenario that oil exploration management appears to believe in, too, because a survey of the leading oil and gas exploration and production companies’ latest earnings presentations shows that only Diamondback Energy increased its capital spending plans for 2026, from $3.75 billion to $3.9 billion. In other words, don’t expect an aggressive ramp-up in U.S. oil and gas production over the near term to save the day if global supplies remain curtailed.