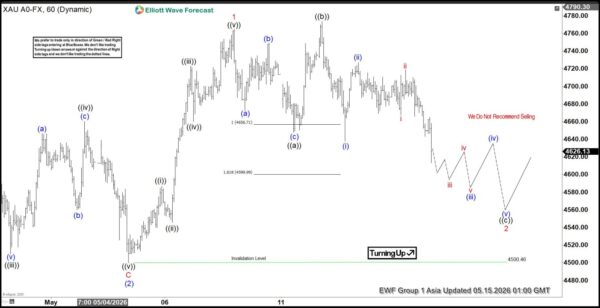
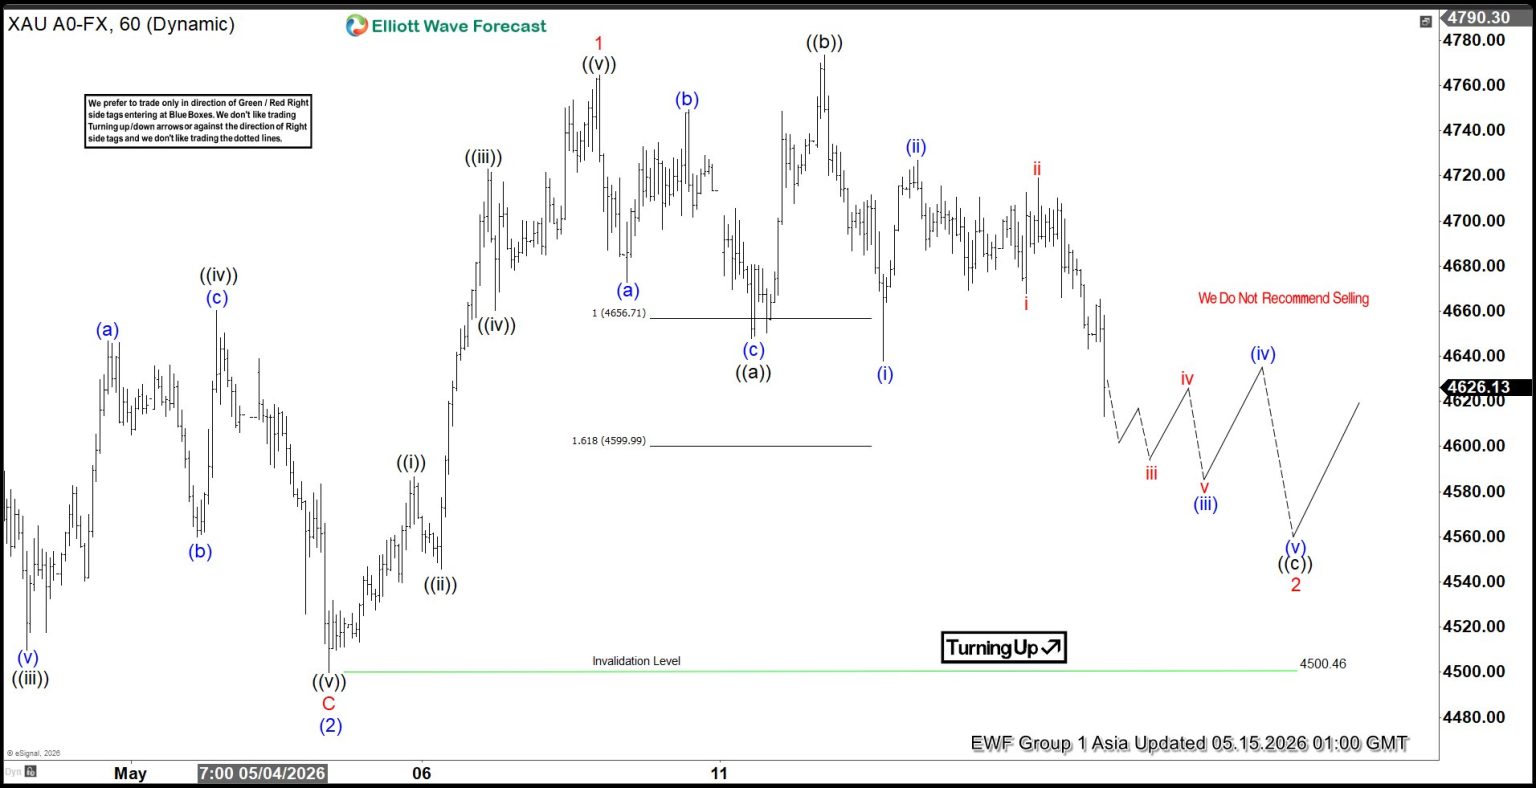
After completing the correction at $4098.74 on the March 23 low, Gold (XAUUSD) initiated a rally in a clear impulsive structure. From that level, wave (1) advanced and concluded at $4890.97. The subsequent pullback in wave (2) finished at $4500.46, as reflected in the one‑hour chart. Following this retracement, the metal resumed its upward movement in wave (3). However, confirmation of this view requires a decisive break above the prior wave (1) peak at $4890.97. From the wave (2) low, wave 1 advanced and ended at $4764.73.
At present, wave 2 is unfolding as a corrective phase to address the cycle that began on May 5, 2026. The internal structure of this wave is developing as an expanded flat formation within the Elliott Wave framework. Declining from wave 1, wave ((a)) terminated at $4647.71, while wave ((b)) completed at $4773.58. The ongoing wave ((c)) of 2 is progressing lower in impulsive fashion, with potential to retest the $4500.46 level before a renewed advance occurs. This decline is part of the corrective sequence rather than a reversal of the broader trend.
In the near term, the key pivot remains the $4500.46 low. As long as this level holds, the expectation favors a resumption of the upward cycle once the correction completes. The broader structure suggests that Gold is consolidating within a corrective pattern, yet the underlying impulsive bias remains intact. Traders should monitor the completion of wave ((c)) closely, as it will likely set the stage for the next bullish phase.
Gold Futures (XAUUSD) 60-Minute Elliott Wave Chart
XAUUSD Elliott Wave Video:
You are currently viewing a placeholder content from Default. To access the actual content, click the button below. Please note that doing so will share data with third-party providers.
