If you are wondering whether EZCORP is still good value after its recent run, the key question is how its current share price compares with what the business might reasonably be worth.
EZCORP shares last closed at US$26.53, with returns of 4.6% over 7 days, 23.7% over 30 days, 32.3% year to date, 92.8% over 1 year, 192.8% over 3 years and a gain over 5 years of about 4x.
This pricing sets the backdrop for assessing how the market is reacting to EZCORP related news, including ongoing interest in pawn and consumer finance names and investor focus on companies tied to everyday lending and retail cash needs. Together, these themes help explain why traders are paying close attention to where EZCORP is valued today.
Despite these returns, EZCORP currently has a valuation score of 1 out of 6, so we will look at how different valuation approaches treat the stock and then finish with a view on a more complete way to think about its value.
EZCORP scores just 1/6 on our valuation checks. See what other red flags we found in the full valuation breakdown.
The Excess Returns model asks a simple question: after paying its shareholders a reasonable required return, how much extra value can EZCORP generate from its equity base and reinvested earnings over time?
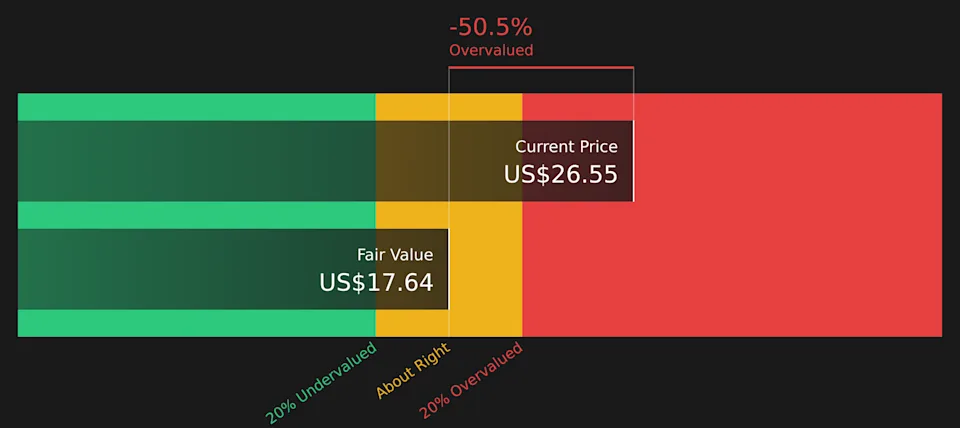
Here, the starting point is Book Value of $17.35 per share and a Stable Book Value of $14.64 per share, based on weighted future estimates from 2 analysts. Using the median Return on Equity from the past 5 years, the model arrives at a Stable EPS of $1.43 per share. Against a Cost of Equity of $1.26 per share, that leaves an Excess Return of $0.17 per share, which represents the annual value creation above investors’ required return.
Those excess returns are projected forward and discounted back to today to get an intrinsic value estimate of about $17.87 per share for EZCORP. Compared with the recent share price of $26.53, this indicates the stock trades at roughly a 48.4% premium to the Excess Returns estimate. On this method alone, the valuation appears stretched.
For a profitable company like EZCORP, the P/E ratio is a useful shorthand for how much you are paying for each dollar of earnings. It lets you quickly compare what the market is willing to pay for EZCORP’s profits against similar businesses.
What counts as a “normal” or “fair” P/E depends on how investors view a company’s growth prospects and risk. Higher expected growth or lower perceived risk can support a higher P/E, while slower growth or higher risk usually goes with a lower P/E.
EZCORP currently trades on a P/E of 13.32x. That sits above the Consumer Finance industry average of 8.65x and above the peer group average of 5.93x. Simply Wall St’s Fair Ratio for EZCORP is 13.31x. This is its proprietary view of what a reasonable P/E should be after factoring in the company’s earnings profile, industry, profit margins, market cap and specific risk characteristics.
This Fair Ratio can be more useful than a simple peer or industry comparison because it adjusts for those company specific factors rather than applying a broad sector average. With the current P/E of 13.32x almost in line with the Fair Ratio of 13.31x, EZCORP’s valuation on this measure looks about right.
Earlier we mentioned that there is an even better way to understand valuation, so let us introduce you to Narratives, which are simple stories you create about a company like EZCORP that connect your view of its future revenue, earnings and margins to a financial forecast and a Fair Value that you can compare with today’s share price.
On Simply Wall St’s Community page, millions of investors use Narratives to set out their own assumptions, then see a Fair Value that updates automatically when fresh information such as earnings or news comes in. This can help them decide whether the current price looks high, low or roughly in line with their expectations.
For EZCORP, one investor might build a more optimistic Narrative that lines up with a Fair Value of US$36.00, while another might lean on a more cautious Narrative closer to US$26.00. By comparing either of those Fair Values to the current market price, each investor can then decide whether the stock better fits a potential buy, hold or sell decision for their own portfolio and risk tolerance.
For EZCORP however we’ll make it really easy for you with previews of two leading EZCORP Narratives:
🐂 EZCORP Bull Case
Fair value: US$36.00 per share
Implied price gap versus last close: EZCORP trades at about 26.3% below this fair value estimate
Revenue growth assumption: 15.21% a year
Supports a higher fair value that reflects analyst work pointing to a larger opportunity in underpenetrated markets, especially Latin America, alongside ongoing M&A and store expansion.
Assumes digital tools, data driven pricing and analytics improve efficiency and margins over time, with analysts using these inputs to justify higher long term earnings and valuation multiples.
Flags risks around slow digital rollout, gold price sensitivity, regulation and regional economic conditions, and encourages you to test whether the bullish growth, margin and P/E assumptions feel realistic.
🐻 EZCORP Bear Case
Fair value: US$26.00 per share
Implied price gap versus last close: EZCORP trades at about 2.0% above this fair value estimate
Revenue growth assumption: 15.07% a year
Begins from a lower fair value that sits close to the recent share price and reflects concerns that competition from fintech, rising financial inclusion and regulation could cap long term growth.
Assumes the business continues to grow, but questions whether heavy physical store exposure, inventory trends and reliance on gold prices will limit future margin improvement.
Highlights execution, integration and capital allocation risks around acquisitions and buybacks, and asks whether a relatively full valuation leaves much room for setbacks.
This article by Simply Wall St is general in nature. We provide commentary based on historical data and analyst forecasts only using an unbiased methodology and our articles are not intended to be financial advice. It does not constitute a recommendation to buy or sell any stock, and does not take account of your objectives, or your financial situation. We aim to bring you long-term focused analysis driven by fundamental data. Note that our analysis may not factor in the latest price-sensitive company announcements or qualitative material. Simply Wall St has no position in any stocks mentioned.