The Euro (EUR) has retraced most of the daily gains against the US Dollar (USD), and trades near 1.1900 at the time of writing on Wednesday after rejection from February’s highs in the area of 1.1925. The pair, however, remains 1.1% above last week’s lows, as downbeat US data has sparked fresh concerns about the economic outlook, as the focus shifts to the the release of January’s delayed Nonfarm Payrolls (NFP) report.
US Retail Sales remained flat in December, against expectations, suggesting that consumption, which accounts for nearly 70% of the GDP, will have a weaker contribution to US growth in the last quarter of 2025.
Beyond that, labour costs slowed down in the fourth quarter, pointing to a steadier labour market and providing further reasons for the US Federal Reserve (Fed) to ease its monetary policy.
The economic calendar is thin during Wednesday’s European session, and all eyes will be on the US Nonfarm Payrolls Report due later in the day. Later on, Kansas City Fed President Jeffrey Schmid, the Fed’s Vice Chair for Supervision Michelle Bowman, and Cleveland Fed President Beth Hammack will take the stage. European Central Bank (ECB) committee member Isabel Schnabel is also expected to meet the press during the US trading session.
Euro Price Today
The table below shows the percentage change of Euro (EUR) against listed major currencies today. Euro was the strongest against the Canadian Dollar.
| USD | EUR | GBP | JPY | CAD | AUD | NZD | CHF | |
|---|---|---|---|---|---|---|---|---|
| USD | -0.05% | -0.29% | -0.49% | 0.00% | -0.52% | -0.24% | -0.07% | |
| EUR | 0.05% | -0.23% | -0.48% | 0.05% | -0.47% | -0.18% | 0.00% | |
| GBP | 0.29% | 0.23% | -0.25% | 0.29% | -0.24% | 0.04% | 0.24% | |
| JPY | 0.49% | 0.48% | 0.25% | 0.51% | -0.02% | 0.27% | 0.47% | |
| CAD | 0.00% | -0.05% | -0.29% | -0.51% | -0.52% | -0.24% | -0.05% | |
| AUD | 0.52% | 0.47% | 0.24% | 0.02% | 0.52% | 0.29% | 0.48% | |
| NZD | 0.24% | 0.18% | -0.04% | -0.27% | 0.24% | -0.29% | 0.19% | |
| CHF | 0.07% | -0.00% | -0.24% | -0.47% | 0.05% | -0.48% | -0.19% |
The heat map shows percentage changes of major currencies against each other. The base currency is picked from the left column, while the quote currency is picked from the top row. For example, if you pick the Euro from the left column and move along the horizontal line to the US Dollar, the percentage change displayed in the box will represent EUR (base)/USD (quote).
Daily Digest market Movers: Soft data keeps the US Dollar on the defensive
- US consumption data added pressure to an already soft US Dollar on Tuesday. Retail Sales remained flat in December, against expectations of a 0.4% growth and following a 0.6% increase in November. The Retail Sales Control Group, also known as the “core” Retail Sales have contracted 0.1% with November’s reading revised down to a 0.2% growth from the previoius 0.4% estimation.
- Also on Tuesday, data from the Bureau of Labor Statistics (BLS) revealed that the US Employment Cost Index slowed down to 0.7% in Q4 from 0.8% in the previous quarter, with the annual rate growing at its slowest pace since 2021.
- Recent US data has endorsed the dovish party of the Federal Reserve’s committee, prompting investors to ramp up their bets for monetary easing in 2026. Futures markets are pricing nearly 75% chances of a rate cut in June and between two and three cuts before December, according to the CME Fedwatch tool, and compared with the quarter-point monetary easing projected by the Fed.
- Later on Wednesday, US NFP data is expected to show a 70K increase in payrolls in January, up from the 50K net jobs created in December. The Unemployment Rate is forecast to remain steady at 4.4%, and wages are expected to have slowed down to a 3.6% yearly growth, from 3.8% in December.
- On Monday, the White House economic adviser Kevin Hassett affirmed that job growth will remain slow in the coming months due to US President Donald Trump’s migration policies and a sharp increase in productivity, which has dampened expectations for a bright NFP report.
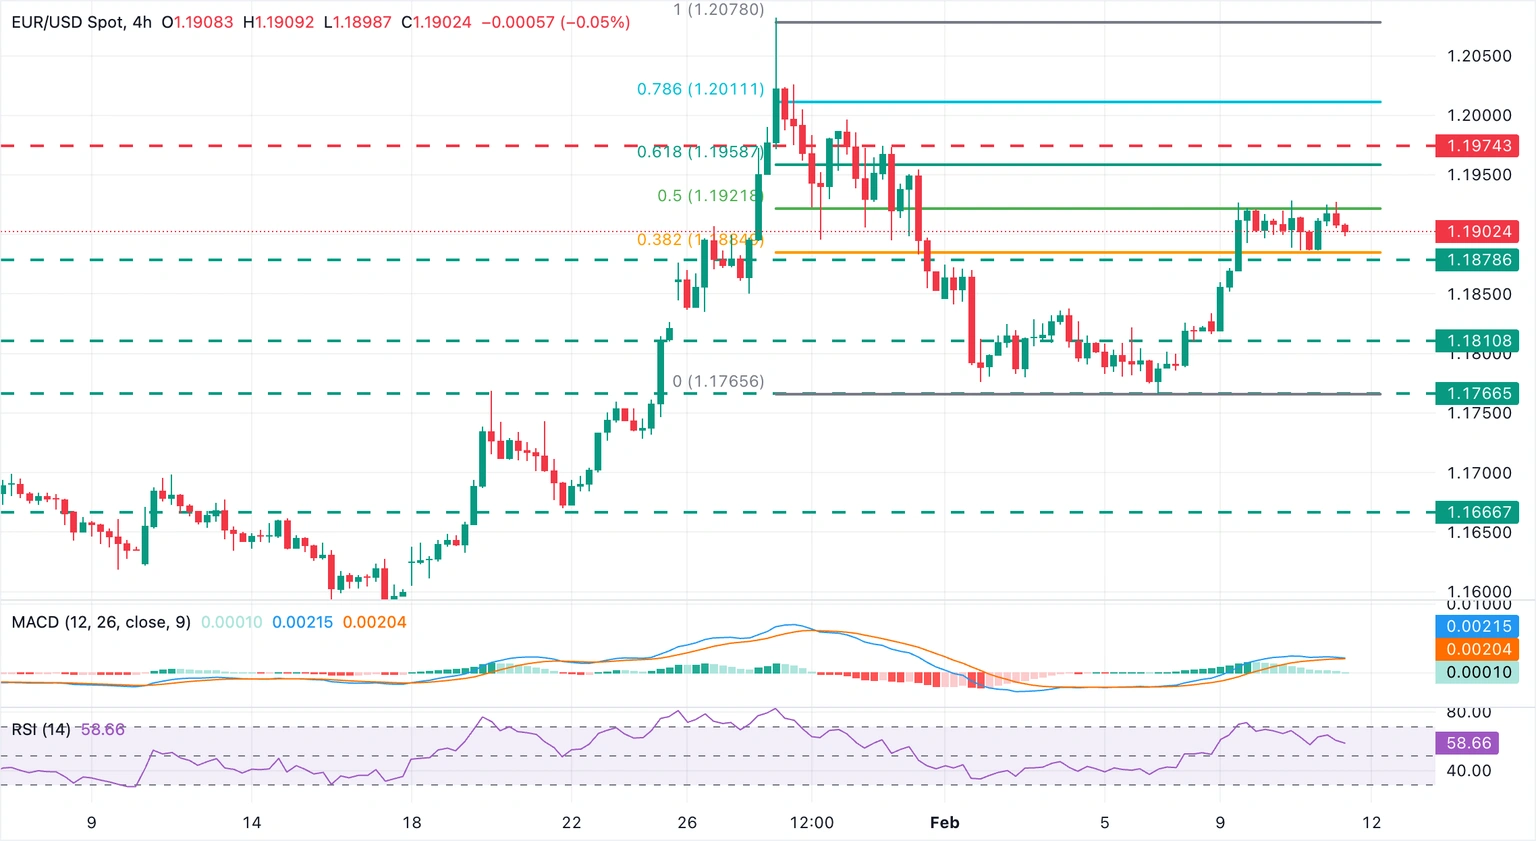
Technical Analysis: EUR/USD recovery stalls below 1.1925

The 4-hour chart shows EUR/USD trading sideways between the 38.2% and the 50% Fibonacci retracements of the late January selloff. The immediate bias remains positive, although technical indicators highlight a softer momentum.
The Moving Average Convergence Divergence (MACD) remains in positive territory, but the MACD line seems ready to cross below the signal line in what would be a bearish move. The Relative Strength Index (RSI), on the other hand, stands above 60, showing a moderate bullish strength.
The mentioned 50% Fibonacci level and Monday’s high, in the area of 1.1925, are closing the path towards the January 30 high near 1.1975. On the downside, the 38.2% Fibonacci retracement aligns with session lows around 1.1885. A confirmation below that level would add pressure towards Monday’s low near 1.1815.
(The technical analysis of this story was written with the help of an AI tool.)
Economic Indicator
Nonfarm Payrolls
The Nonfarm Payrolls release presents the number of new jobs created in the US during the previous month in all non-agricultural businesses; it is released by the US Bureau of Labor Statistics (BLS). The monthly changes in payrolls can be extremely volatile. The number is also subject to strong reviews, which can also trigger volatility in the Forex board. Generally speaking, a high reading is seen as bullish for the US Dollar (USD), while a low reading is seen as bearish, although previous months’ reviews and the Unemployment Rate are as relevant as the headline figure. The market’s reaction, therefore, depends on how the market assesses all the data contained in the BLS report as a whole.
Economic Indicator
Unemployment Rate
The Unemployment Rate, released by the US Bureau of Labor Statistics (BLS), is the percentage of the total civilian labor force that is not in paid employment but is actively seeking employment. The rate is usually higher in recessionary economies compared to economies that are growing. Generally, a decrease in the Unemployment Rate is seen as bullish for the US Dollar (USD), while an increase is seen as bearish. That said, the number by itself usually can’t determine the direction of the next market move, as this will also depend on the headline Nonfarm Payroll reading, and the other data in the BLS report.