The stock market is inching closer to an important threshold last seen during the dot-com boom.
The long-run average return of the S&P 500 (^GSPC 0.06%) is about 7% after both inflation and dividend reinvestment are taken into account. Thanks to tailwinds from artificial intelligence (AI), however, the stock market has been on a historical rally for a few years now.
Since 2023, the S&P 500 has generated a return of 21% per year on average — essentially triple the index’s long-term average. While AI remains the market’s biggest theme, smart investors are looking beyond soaring stock prices and paying attention to more nuanced valuation indicators.
Below, we’ll dig into an important metric used to gauge the stock market’s health and assess where the S&P 500 could be headed based on historical data.
Image source: Getty Images.
The stock market is flashing a signal last seen in the year 2000
The chart below illustrates trends in the cyclically adjusted price-to-earnings (CAPE) ratio. The CAPE ratio is pretty nifty because it measures stock prices relative to earnings growth over 10 years — essentially creating a normalized view of valuation, independent of one-time anomalies as well as inflation.
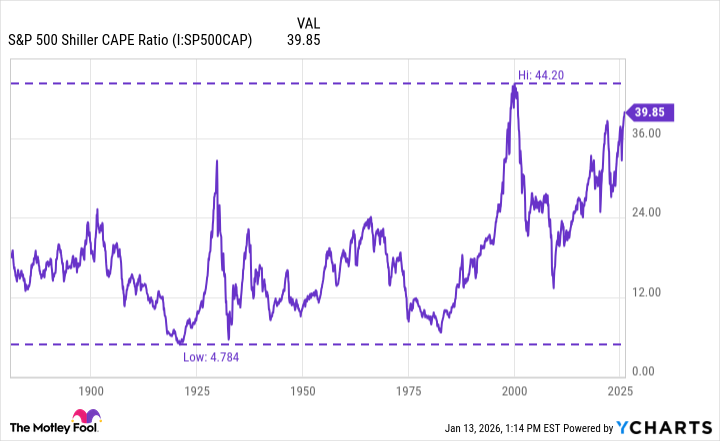
S&P 500 Shiller CAPE Ratio data by YCharts
The CAPE ratio currently sits at 39.8. The last time it reached this height was in 2000, just prior to the dot-com crash.
What does a rising CAPE ratio mean?
Investors can see that there are only two other times in history that the CAPE ratio soared to such abnormally high levels. In addition to the dot-com era, it happened in the 1920s.
In both instances, the stock market sustained historic drops, ushering in a period of brutal corrections. Against this backdrop, history suggests that the stock market could very well be headed for a reversal not only in 2026, but also beyond this year.
But a rising CAPE ratio doesn’t necessarily guarantee an imminent sell-off. Rather, when the ratio continues to surge, it tends to reflect broader optimism across the market, which can, and often is, eventually followed by lower returns as premium prices become increasingly fragile.
Will the stock market crash in 2026?
While the stock market could be on a collision course with history, smart investors should take a step back.
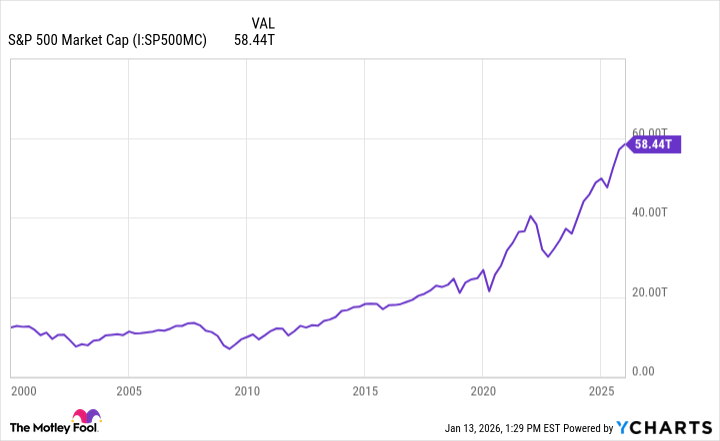
S&P 500 Market Cap data by YCharts
The S&P 500 currently has a total market capitalization of $58 trillion. The 10 most valuable companies in the world have a combined market value of roughly $26 trillion — or 44% of the index.
This is important, as it implies the S&P 500’s movements are largely dictated by an extremely small cohort of trillion-dollar companies — the majority of which are riding high thanks to the AI bull narrative.
Viewed through the lens of forward earnings multiples, heavy hitters like Nvidia, Alphabet, Meta Platforms, Broadcom, Amazon, and Taiwan Semiconductor Manufacturing look reasonably valued — if not cheap.
In essence, this means that even though the entire stock market is getting frothy, the most expensive — or potentially most vulnerable — positions are outside the top 10 or 15 largest stocks by market cap.
To me, the most prudent action right now is to reduce exposure to highly volatile growth stocks or any speculative positions you may be hoping turn into multibaggers. For now, smart investors should opt for more durable businesses with diversified business models.
Many of the companies above qualify as blue chip stocks and have good track records. Complementing your high-conviction positions with cash should also prove wise.
This strategy will help strengthen your portfolio for the long haul, whether the stock market crashes in 2026 or not.
Adam Spatacco has positions in Alphabet, Amazon, Meta Platforms, and Nvidia. The Motley Fool has positions in and recommends Alphabet, Amazon, Meta Platforms, Nvidia, and Taiwan Semiconductor Manufacturing. The Motley Fool recommends Broadcom. The Motley Fool has a disclosure policy.