Key Takeaways
- Tesla shares fell Thursday morning after the company’s quarterly profit came in short of analysts’ estimates, even as it returned to revenue growth following two quarters of declines.
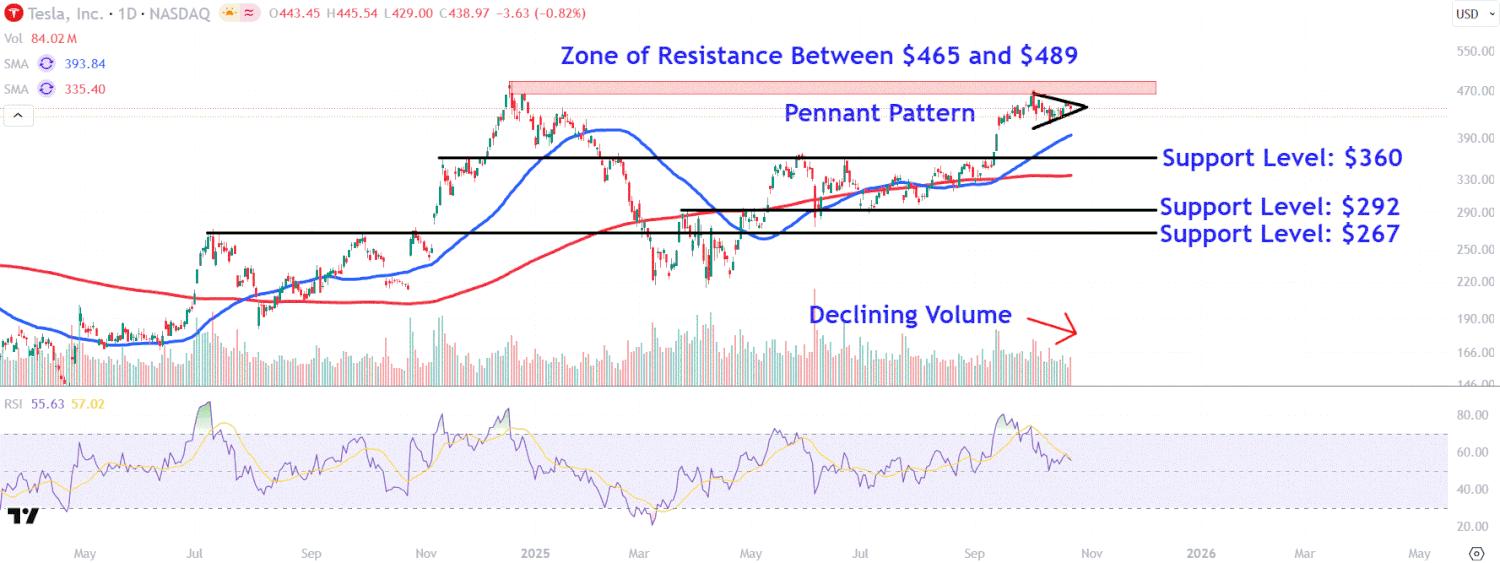
- The stock looks set to break down below a pennant pattern in Thursday’s trading session, suggesting waning bullish momentum and the potential for a near-term pullback.
- A post-earnings drop could see Tesla shares test key support levels around $360, $292 and $267.
- During upswings, the stock could run into selling pressure near a zone of resistance between $465 and $489.
Tesla (TSLA) shares fell Thursday morning after the company’s quarterly profit came in short of analysts’ estimates, even as it returned to revenue growth following two quarters of declines.
The company reported adjusted earnings of 50 cents per share in the period, missing the average Wall Street estimate of 54 cents a share. Lower EV prices and higher operating costs tied to restructuring and AI investments dented the bottom line. CEO Elon Musk told analysts that Tesla is at a “critical inflection point” as it focuses on its next phase of growth, which will center on “real-world” applications of AI, including self-driving cars and smart robots.
Tesla shares were down 5% at around $418 in the opening minutes of Thursday’s session. The stock, which was the top performer among Magnificent Seven stocks in the third quarter, was up 9% for the year through Wednesday’s close.
Below, we break down the technicals on Tesla’s chart and identify key price levels worth watching out for.
Pennant Pattern Breakdown
After hitting their 2025 high earlier this month, Tesla shares have consolidated within a pennant, a chart pattern signaling a continuation of the stock’s recent uptrend.
However, the price looks set to break down below the pattern in Thursday’s trading session following the weaker-than-expected earnings, suggesting waning bullish momentum and the potential for a near-term pullback.
It’s also worth noting that volume has declined during the pennant pattern, indicating a lack of conviction among buyers and sellers ahead of the company’s quarterly results.
Let’s identify three key support levels to watch on Tesla’s chart if the shares lose ground and also point out a zone of resistance worth monitoring during potential upswings in the stock.
Key Support Levels to Watch
The first level to watch sits around $360. This area, roughly midway between the 50- and 200-day moving averages, would likely attract buyers’ attention near a trendline that links a series of peaks on the chart between November and August.
Selling below this level could see the shares retreat toward $292. The price may find support in this location near the March countertrend high and a cluster of trading activity spanning from April to July.
A more-significant retracement may spark a decline to the $267 level. Investors could see this as a high probability buying area near three prominent peaks that formed on the chart in July, September, and October last year.
Zone of Resistance Worth Monitoring
During upswings in Tesla shares, investors should keep a close eye on a zone of resistance between $465 and $489. Those who have purchased at lower prices may seek exit points in this region near the top of the pennant pattern and the stock’s record high.
The comments, opinions, and analyses expressed on Investopedia are for informational purposes only. Read our warranty and liability disclaimer for more info.
As of the date this article was written, the author does not own any of the above securities.


