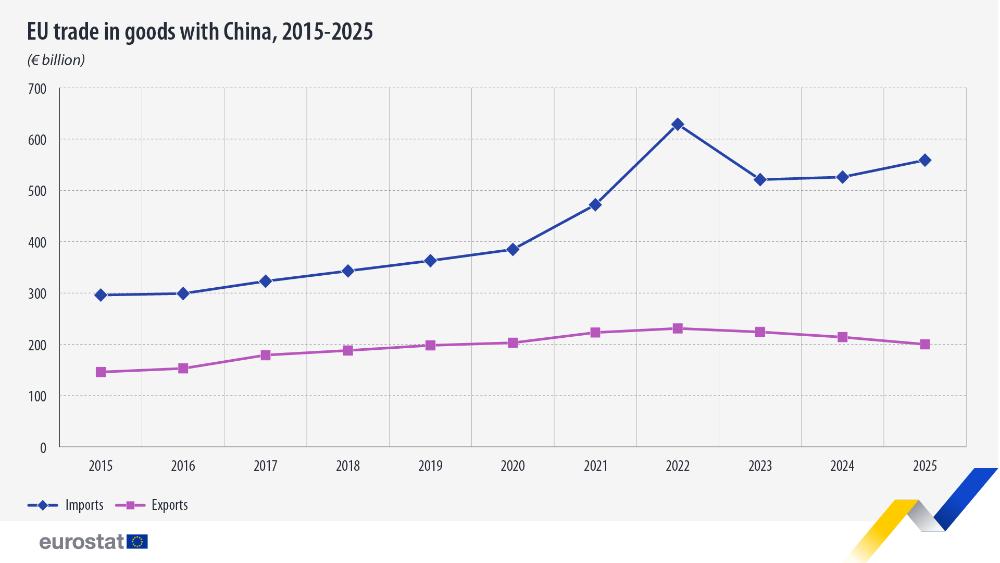
In 2025, the EU exported €199.6 billion worth of goods to China and imported €559.4 billion, resulting in a trade deficit of €359.8 billion.
Compared with 2024, exports decreased by 6.5% while imports increased by 6.4%. When looking at 2015, exports increased by 37.1% from €145.6 billion and imports by 89.0% from €295.9 billion.

Source dataset: ds-059331
Machinery products – top trading products
When looking into the breakdown, according to the Harmonized System (HS), the top 5 most exported product groups in 2025 accounted for 59.8% of all exports to China. Machinery, mechanical appliances and parts was the most exported product group, totaling €45.3 billion (22.7% of all exports to China), followed by electrical machinery and parts, audio-visual equipment and accessories (€29.0 billion; 14.5%) and vehicles other than railway or tramway rolling stock (€16.4 billion;8.2%). Optical, photographic, cinematographic, precision, medical or surgical instruments (€15.1 billion; 7.5%) and pharmaceutical products (€13.6 billion; 6.8%) came next.
For imports, the top 5 categories accounted for 63.8% of all imported goods. Electrical machinery and parts, audio-visual equipment and accessories was the most imported product category in 2025, with €164.9 billion in products (29.5% of all imports), followed by machinery, mechanical appliances and parts (€106.5 billion; 19.0%). The category organic chemicals (€34.1 billion; 6.1%) was next, followed by vehicles other than railway or tramway rolling stock (€29.9 billion; 5.4%) and furniture and lighting, bedding and mattresses and prefabricated buildings (€21.3 billion; 3.8%).

Source dataset: ds-045409