Metals are slowly recovering after their high-paced deleveraging from late January trading.
Establishing consolidative ranges and holding tight right around their 2026 opening levels, the Precious Commodities are facing key technical tests in their historic runs.
Indeed, after their shocking up-and-down performances in the first two months of the year, it is even more astonishing to see that they are mostly back to where they were before year-end, with Gold leading the pack with more modest 16% gains (check out their yearly performance right here).
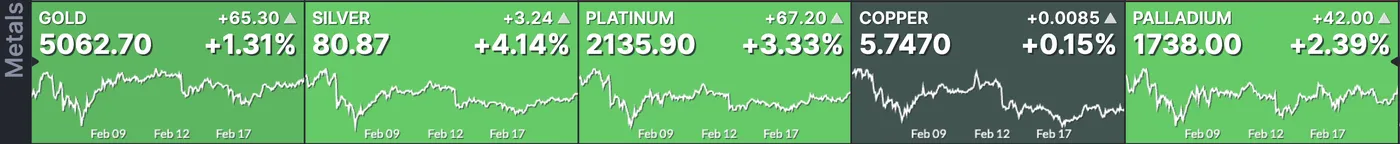
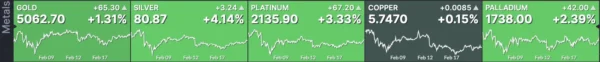
Metals performance in today’s session – Source: Finviz. February 20, 2026
As speculation tones down, up sessions have been much more contained, which bodes well for a more stable price action ahead. Ranging between 2% and 3%, the daily rally in metals changes from the +10% ranges that almost became the new normal throughout January.
Futures Traders are now awaiting deliveries, and the COMEX has sent out notices. Concerns regarding the exchange’s low inventory levels are arising, but the Market hasn’t reacted to such news, so take that with a pinch of salt.
Overall, Metals are still in a rangebound trajectory since their correction, providing non-directional trading opportunities. However, directional traders will have to wait for a further breakout.
What may console Gold and Silver bulls is the heating tone regarding a military intervention in Iran, which would create a spike in Safe-Haven demand. Nevertheless, Gold would be more inclined to rally than the more volatile Silver, and with heavy positioning, any rally could see its potential capped.
Still, flight to quality may push Silver higher.
We will dive into a Silver multi-timeframe analysis to identify where the next breakout could occur and whether anything tilts the scales in favor of the Commodity. Let’s get right into it.
Silver (XAG/USD) Multi-timeframe Technical Analysis
Daily Chart
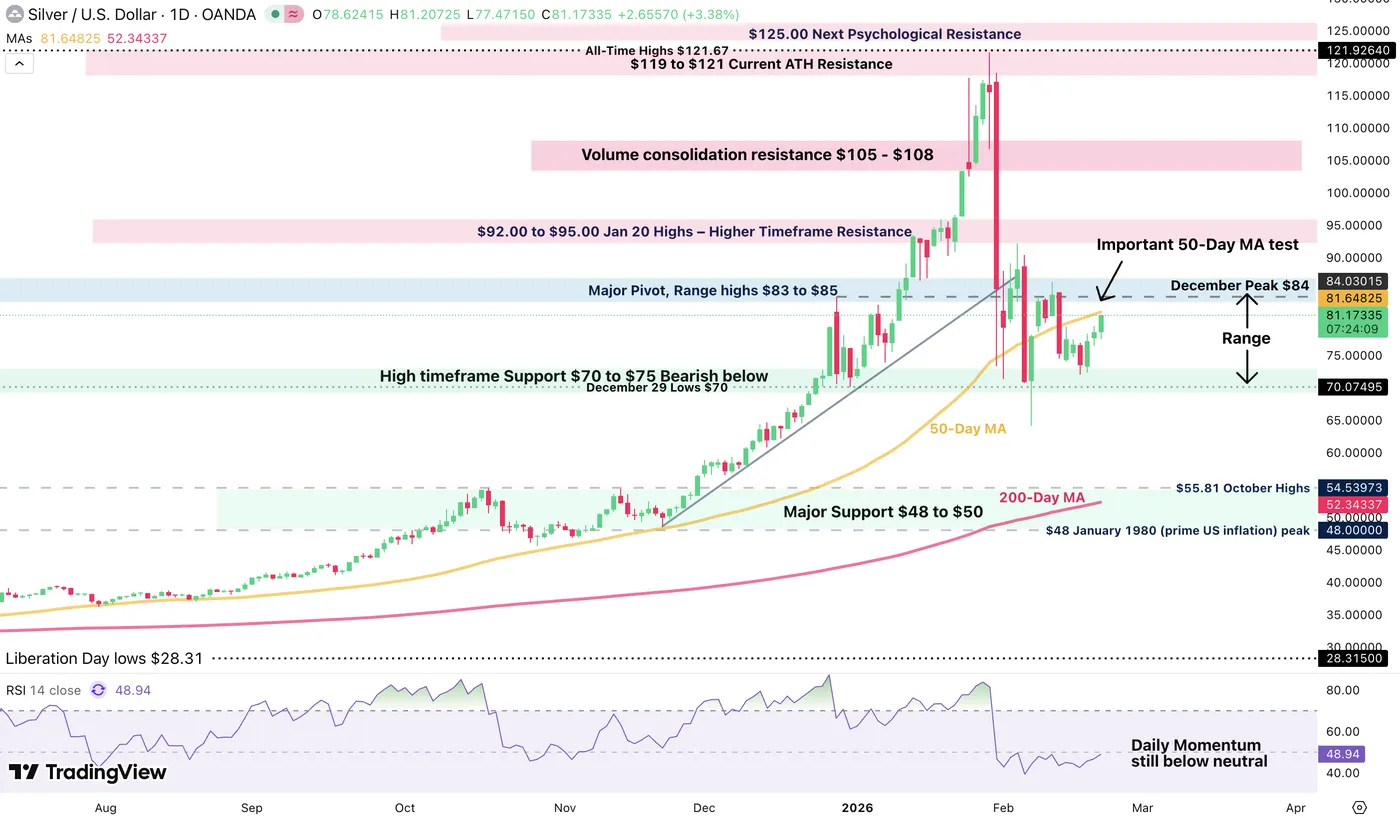
Silver Daily Chart, February 20, 2026 – Source: TradingView
The current price action in Silver is one of hesitant recovery as prices maintain solidly between $70 and $84, a major range.
RSI Momentum is still below neutral territory, indicating a higher potential for correction, particularly as the 50-Day Moving Average is coming at resistance.
Take a close look to reactions if and when trading reaches that price level ($81.65)
4H Chart and Technical Levels
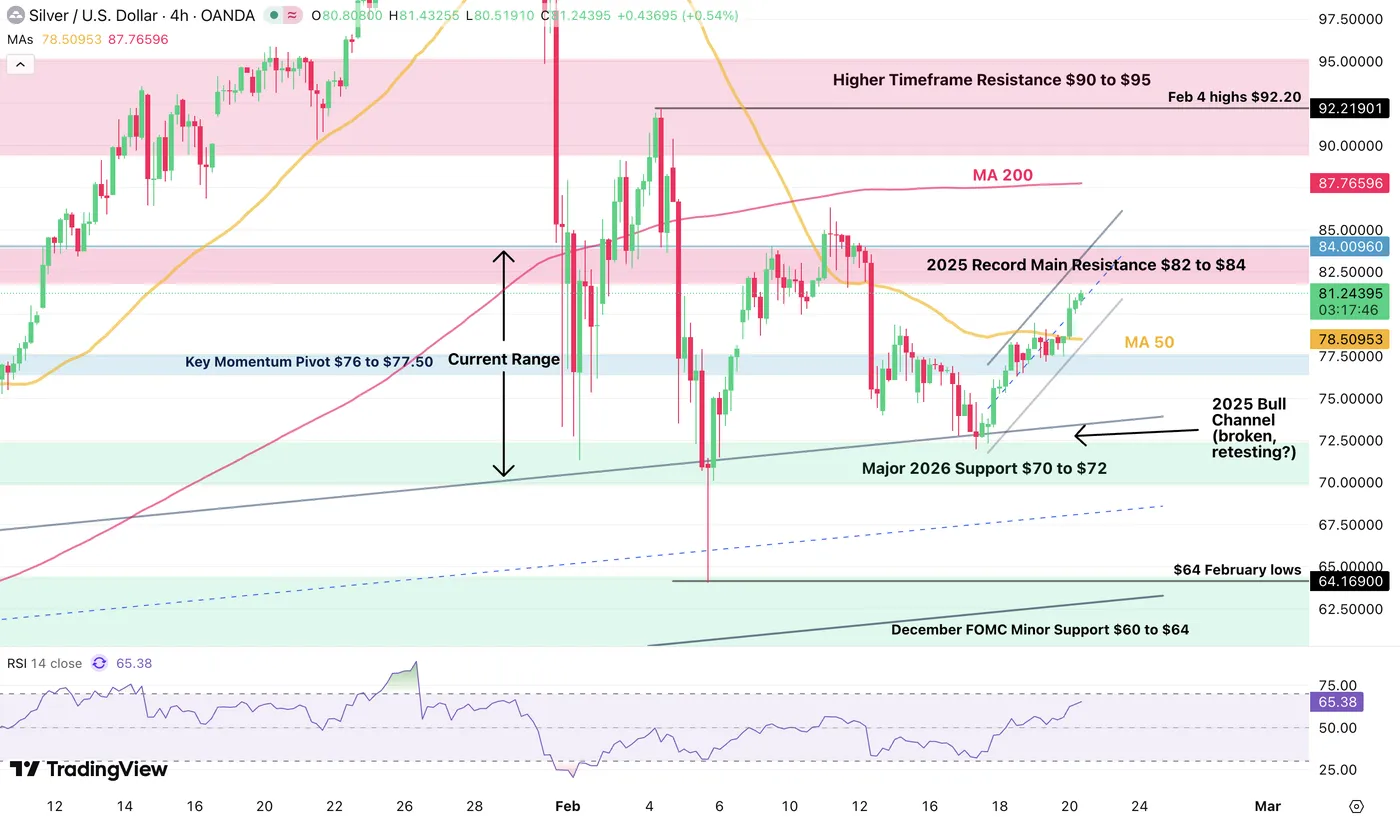
Silver 4H Chart, February 20, 2026 – Source: TradingView
Looking closer, Bulls are attempting to take the advantage, forming a strong rebound after retesting the 2025 broken bull channel and the action is now breaking the 50-Day MA.
If they manage a daily close above the Daily Moving Average (see level above), Silver could see higher chances of an upside breakout. Today’s session close and Monday open will be very essential in that aspect.
- Breaking above $84 points to much higher chances to retest the $100 level.
Levels to watch for Silver (XAG) trading:
Resistance Levels:
- Attempting a break above 50-Day MA $81.65 (Watch the close)
- 2025 Record Main Resistance $82 to $84
- 4H 200-MA $87.76
- Higher Timeframe Major Resistance $90 to $95
- Key psychological resistance $100 to $104
Support Levels:
- Key Momentum Pivot $76 to $77.50
- Major 2026 Range Support $70 to $72
- December FOMC Minor Support $60 to $64 (Feb Lows)
- $50 to $54 Major Support
- October FOMC bottom $46.00 to $47.00
1H Chart
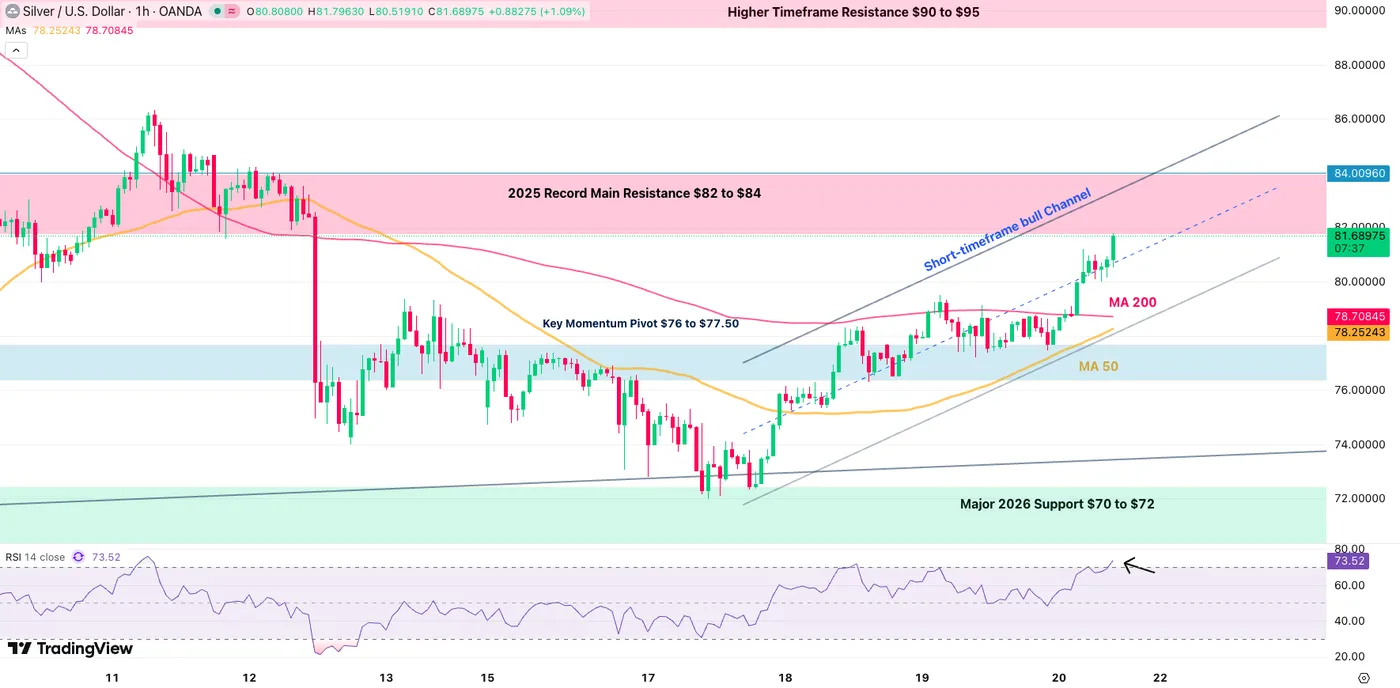
Silver 1H Chart, February 10, 2026 – Source: TradingView
Silver is now evolving well within an intraday bull channel which is the indicator to watch for short-term trading.
- Holding it will be essential to provide a more balanced and sustainable rally ahead.
- Breaking the channel would confirm the $70 to $84 Range which should then hold for longer.
Safe Trades!

