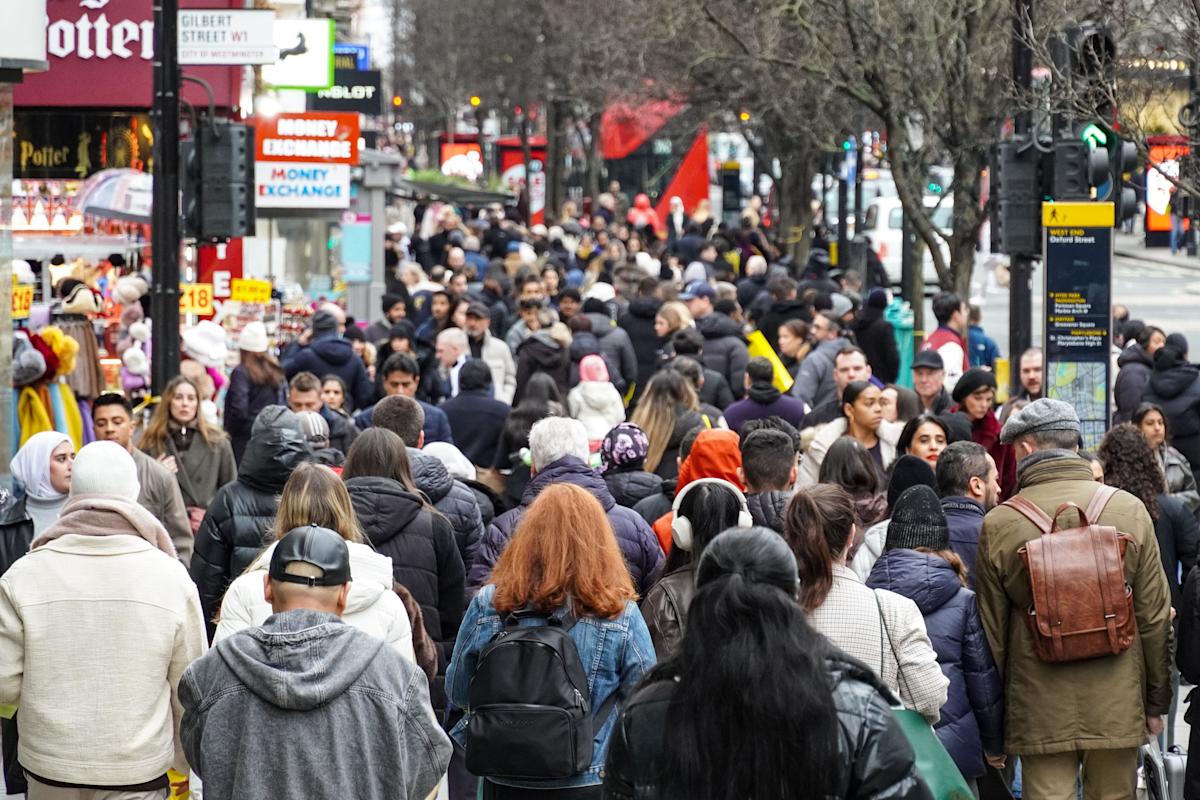
Population growth in the UK is believed to be slowing down due to a drop in migration, figures suggest.
According to figures released in January by the Office for National Statistics (ONS), the population was projected to increase by 7.3% between mid-2022 and mid-2032.
However, this has now been revised to the new figure of 5.9%, after the ONS said its short-term projections were “running too high” due to a lack of net migration data.
With migration being the main driver of population growth, the ONS has now adjusted its initial projection to the new figure of 5.9%.
Areas like Ipswich in Suffolk and Gosport in Hampshire are projected to see drops in population – but some local areas in London will see an increase of 20%, or even up to 50%.
James Robards, ONS head of population and household projections, said the latest changes reflect “the challenge in projecting the path from unprecedented levels of international migration seen over recent years to a lower long-term average figure and the uncertainty over the speed of decrease”.
Which local areas are seeing the fastest increases in population?
The City of London is the area projected to have the fastest grown, with a projected population increase of 48.6% from mid-2022 to mid-2032. However, this reflects its small base population, growing from 11,457 to 17,023.
Tower Hamlets in London follows closely, with an expected 20.4% rise.
South Derbyshire is another high-growth areas, with a projected 19.2% increase, while Stratford-upon-Avon in Warwickshire is projected to see a 17.4% surge.
Some 47 local authorities are projected to grow by at least 10% over the decade, according to the ONS.
Use the interactive map below to tap on your area and find out more about its population.
What is the current population of the UK?
As of mid-2023, the UK’s population stood at an estimated 68.3 million, according to the ONS. This represents an increase of 1% from the previous year.
By mid-2027 – five year after the last estimates from the ONS – the population is projected to reach approximately 70.2 million, a rise of 2.6 million (3.8%).
By mid-2032 it’s expected to hit 72.5 million, an increase of 4.9 million (7.3%) from 2022.
This growth is driven almost entirely by net migration, estimated at 4.9 million over the 10-year period, as natural change – births minus deaths – is projected to be close to zero, with a similar number of births and deaths in the UK.
England is expected to see the fastest growth at 7.8%, followed by Wales (5.9%), Scotland (4.4%), and Northern Ireland (2.1%).
The figures assume net migration stabilises at 340,000 per year from mid-2028, though the ONS cautions that actual migration levels may vary due to policy changes or unforeseen trends.
Top 10 areas with the highest predicted population growth
-
City of London 48.6% (mid-2022 11,457; mid-2032 17,023)
-
Tower Hamlets 20.4% (mid-2022 323,854; mid-2032 389,845)
-
South Derbyshire 19.2% (mid-2022 111,145; mid-2032 132,463)
-
Stratford-on-Avon 17.4% (mid-2022 138,573; mid-2032 162,678)
-
North West Leicestershire 15.8% (mid-2022 107,666; mid-2032 124,628)
-
South Norfolk 15.5% (mid-2022 144,617; mid-2032 166,982)
-
Salford 15.2% (mid-2022 278,867; mid-2032 321,347)
-
Tewkesbury 15.0% (mid-2022 97,032; mid-2032 111,619)
-
Vale of White Horse 14.9% (mid-2022 142,335; mid-2032 163,566)
-
Harborough 14.4% (mid-2022 100,550; mid-2032 115,004)


