If you have been wondering whether DaVita’s share price offers good value right now, you are not alone. This article focuses squarely on what the current price might mean for long term investors.
DaVita closed at US$111.19 on the latest trading day, with returns of 3.4% over the last 7 days, a 2.9% decline over the last 30 days, a 2.9% decline year to date, a 37.2% decline over the last year, a 32.4% gain over 3 years, and a 0.9% gain over 5 years.
Recent price moves sit against a backdrop of ongoing interest in dialysis and kidney care providers in the US healthcare sector, as investors weigh regulatory developments and reimbursement trends. Broader conversations around healthcare spending and chronic disease management have also kept companies such as DaVita in focus for longer term portfolio decisions.
On our framework, DaVita currently has a valuation score of 6/6. Next we look at what that means across different valuation approaches and why there may be an even better way to think about value by the end of this article.
A Discounted Cash Flow, or DCF, model takes the cash DaVita is expected to generate in the future and discounts those amounts back to today, aiming to estimate what the business might be worth now based on those projected cash flows.
DaVita’s latest twelve month Free Cash Flow (FCF) is about $1.28b. Using a 2 Stage Free Cash Flow to Equity model, future cash flows are projected, starting with an estimated FCF of $1.07b in 2025. Beyond the near term, Simply Wall St extrapolates analyst estimates out over ten years, with projected FCF figures such as $1.26b in 2026 and $1.52b in 2035. These amounts are all discounted back to today using the model’s required return assumptions.
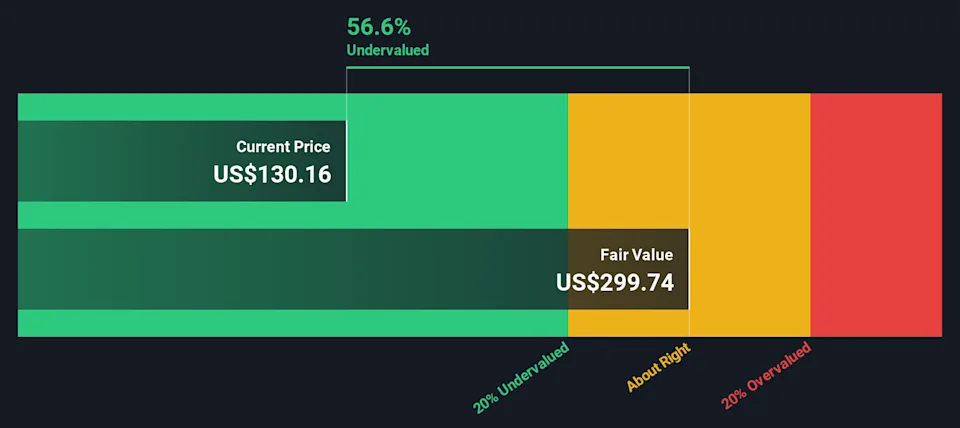
On this basis, the DCF model arrives at an estimated intrinsic value of about $320.89 per share, compared with the recent share price of $111.19. That implies the shares are trading at roughly a 65.3% discount to this DCF estimate.
For a profitable company like DaVita, the P/E ratio is a straightforward way to connect what you pay for the stock with the earnings the business is currently generating. It gives you a quick sense of how many dollars investors are paying for each dollar of earnings.
What counts as a “normal” P/E depends on how the market views a company’s growth prospects and risks. Higher expected growth and lower perceived risk often support a higher multiple, while slower expected growth or higher risk usually align with a lower one.
DaVita currently trades on a P/E of 10.17x. That is below the broader Healthcare industry average of 22.55x and also below the peer group average of 39.51x. Simply Wall St’s “Fair Ratio” for DaVita is 22.50x, which is a proprietary estimate of what the P/E might be given factors such as its earnings growth profile, industry, profit margins, market cap and company specific risks.
Because the Fair Ratio folds these elements into one figure, it can give a more tailored view than a simple comparison with peers or the overall industry. With DaVita trading at 10.17x versus a Fair Ratio of 22.50x, the stock screens as undervalued on this P/E framework.
Earlier we mentioned that there is an even better way to understand valuation, so let us introduce you to Narratives. With Narratives, you combine your view of DaVita’s story with your own assumptions for future revenue, earnings and margins to arrive at a fair value that reflects your thinking.
A Narrative is simply your storyline for the company, linked directly to a set of financial forecasts and a fair value estimate, instead of just relying on one model or a single P/E comparison.
On Simply Wall St, Narratives sit in the Community page and are designed to be easy to use. You can see how your fair value compares with the current price, decide whether DaVita looks attractive or expensive to you, and watch that view update automatically when fresh news or earnings are added to the platform.
For DaVita, one investor might build a Narrative with a very optimistic fair value and robust long term assumptions, while another might set a much more conservative fair value with lower expected growth and margins. Both of those views can coexist side by side for you to compare.
This article by Simply Wall St is general in nature. We provide commentary based on historical data and analyst forecasts only using an unbiased methodology and our articles are not intended to be financial advice. It does not constitute a recommendation to buy or sell any stock, and does not take account of your objectives, or your financial situation. We aim to bring you long-term focused analysis driven by fundamental data. Note that our analysis may not factor in the latest price-sensitive company announcements or qualitative material. Simply Wall St has no position in any stocks mentioned.