

Quick overview
- Ethereum’s price is currently around $2,982, experiencing a slight decline of 0.5% over the last 24 hours.
- The cryptocurrency is trading within a descending channel, with key resistance at $3,060 and support around $2,900.
- Recent price action shows a tightening range, indicating a potential shift in market sentiment as traders analyze technical setups.
- Momentum indicators remain neutral, suggesting that a decisive breakout or continued range-bound trading is imminent.
Ethereum is starting the new year in a steady sort of mode, the price hovering near $2,982 after a 0.5% loss over the last 24 hours, with trading volumes still high at around $14.5 billion. Despite the rather modest tone, Ethereum remains one of the bigger players in the crypto space, coming in as the second largest asset out there with a market cap of a good $360 billion – it’s worth noting there’s around 120.6 million ETH in circulation.
The price action over the past while has been looking more cautious than outright weak. After a wild December, Ethereum has settled into a tighter range as traders take stock at the start of 2026.
With the rest of the crypto markets still trying to figure out some of the bigger-picture stuff and holiday-related trading still having an impact, it’s getting to a point where traders are starting to take a closer look at the technical setup.
Ethereum (ETH/USD) A Descending Channel Defines the Immediate Trend
On the 4-hour chart, ETH is still trading within a descending price channel that has held since mid-December. The upper boundary of this channel has consistently capped any rallies we’ve seen, and the fact that we’re getting higher lows suggests the selling pressure is easing a bit.
The most recent candlesticks have a bit smaller bodies and a bit more compressed ranges; this is a sign that volatility is actually starting to contract.
It is currently stuck in the $2,970-$3,000 range, an area reinforced by a 50-period EMA and a short-term pivot. This clustering of technical levels is why we’re seeing price struggle to break decisively in either direction.
Key Ethereum Levels: $3,060 A Critical Resistance Zone, $2,900 A Support Horizon
Looking at Fibonacci retracements from the December rally, $3,060 is a pretty big upside barrier, and in fact, it aligns with the 38.2 percent retracement and channel resistance. A clean break above this zone would likely get momentum buyers on board and would probably open the door towards $3,180.
On the downside, channel support is rising towards $2,900, while some deeper Fibonacci support is close by at around $2,910. As long as ETH holds above this area, we’re looking at corrective pullbacks rather than a major trend break.
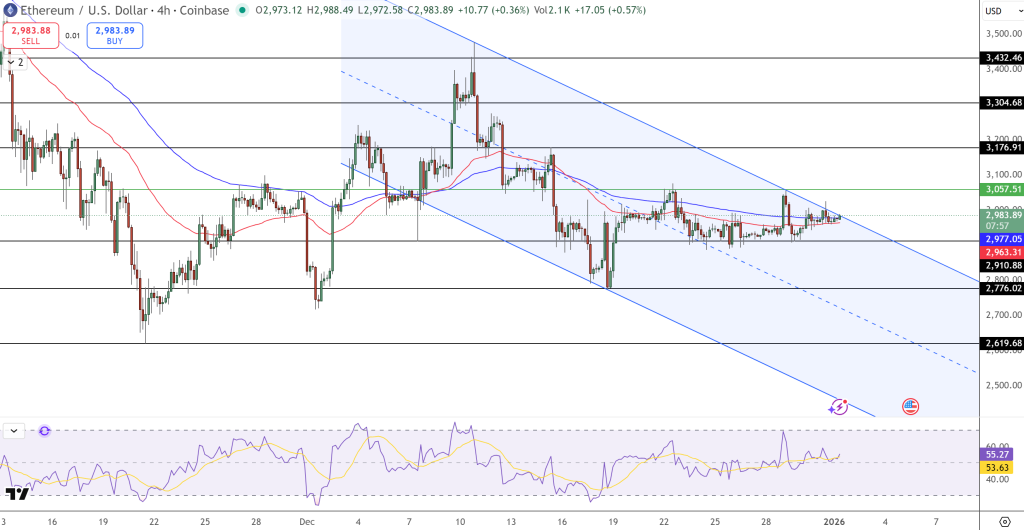
Momentum indicators are still neutral. The RSI is around 55, which suggests a mild bullish bias, but we’re not seeing the kind of strength we’d expect before a sustained breakout.
Key technical takeaways are:
- Resistance at $3,060, then $3,180
- Support at $2,910-$2,900
- The trend is a descending channel, with a tightening range
- Momentum is neutral on the RSI, no exhaustion signals
What Traders Are Watching For
As full market liquidity returns after the New Year break, Ethereum is approaching a decision point. A confirmed break above $3,060 would probably shift sentiment in a pretty big way, while continued rejection keeps eth range-bound into early January.
Arslan Butt
Lead Markets Analyst – Multi-Asset (FX, Commodities, Crypto)
Arslan Butt serves as the Lead Commodities and Indices Analyst, bringing a wealth of expertise to the field. With an MBA in Behavioral Finance and active progress towards a Ph.D., Arslan possesses a deep understanding of market dynamics.
His professional journey includes a significant role as a senior analyst at a leading brokerage firm, complementing his extensive experience as a market analyst and day trader. Adept in educating others, Arslan has a commendable track record as an instructor and public speaker.
His incisive analyses, particularly within the realms of cryptocurrency and forex markets, are showcased across esteemed financial publications such as ForexCrunch, InsideBitcoins, and EconomyWatch, solidifying his reputation in the financial community.